On this page
Overview
VictoriaLogs is a new and prominent player in the log management sector. Developed by the same team behind VictoriaMetrics, the code is not built on top of VictoriaMetrics. Compared to its competitors, VictoriaLogs is more lightweight: one of the key differentiators for VictoriaLogs is its architectural design and usage. It can be used as a standalone log management system or as a command line tool similar to grep. On the query interface, it proposed a new DSL named LogsQL which generally follows a pipe style.
This project is relatively “young”, and a major part of the codebase is from an “initial” patch. The team is and likely will be mainly focusing on the storage (database) part akin to VictoriaMetrics. At the time of writing, there are two ways to visualize the logs: Grafana data source plugin (not available in the plugin store) and a built-in UI. It plans to support cluster mode in early 2025.
Fun fact: VictoriaLogs seems to be proposed by a community contributor. Here is the original list (back to Oct. 2020)
This blog is based on commit e0b2c1c4f5b68070c8945c587e17d6e9415c48b5, Tue Dec 24.
Code line count
Before diving in, let’s have a quick look at the repository. Both VictoriaLogs and VictoriaMetrics, as well as other related projects like agent or alert services, are placed in one main repository.
Pie charts of the code line count:
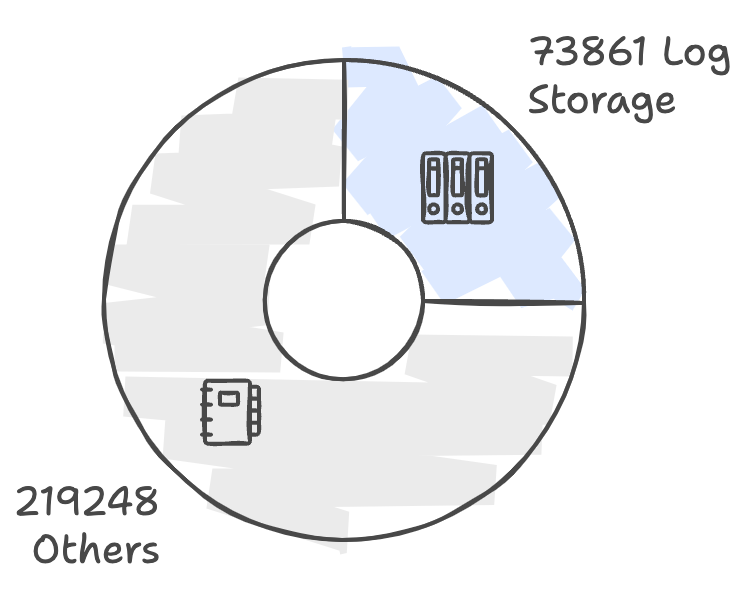
From the above charts, we can see that the logstorage package is nearly 1/4 of this project. To clarify, the logstorage package doesn’t reuse much code from VictoriaMetrics; basic components like block, indexdb, etc., are duplicated with slight differences. This, on the other hand, shows that the project is relatively independent and concise.
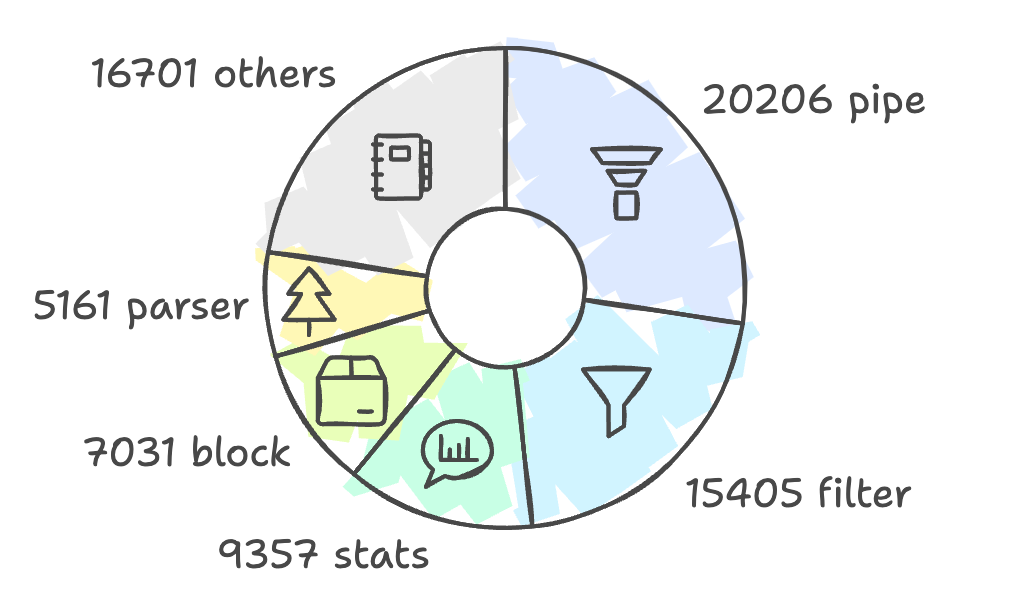
The logstorage package above is the major implementation of VictoriaLogs, including its query language, storage, index, etc. The second figure on the right side is a rough breakdown of logstorage. It’s composed of a few key components: pipe, filter, stats, block, parser, and so on. We will cover them in the following sections.
Another interesting finding is that at either the whole project level or in logstorage, the test code is about 1/2 of the normal logic. For example, inside logstorage, there are 33620 lines of test code among 73861 lines in total.
These two figures can give us a rough idea of the project structure and what might be the key components. Now let’s dive into the code implementation.
Key concepts
Firstly, there are some key concepts and their relations in VictoriaLogs (referred to as logstorage later on) that I came across many times. Some of them are exposed to the user, while others are internal:
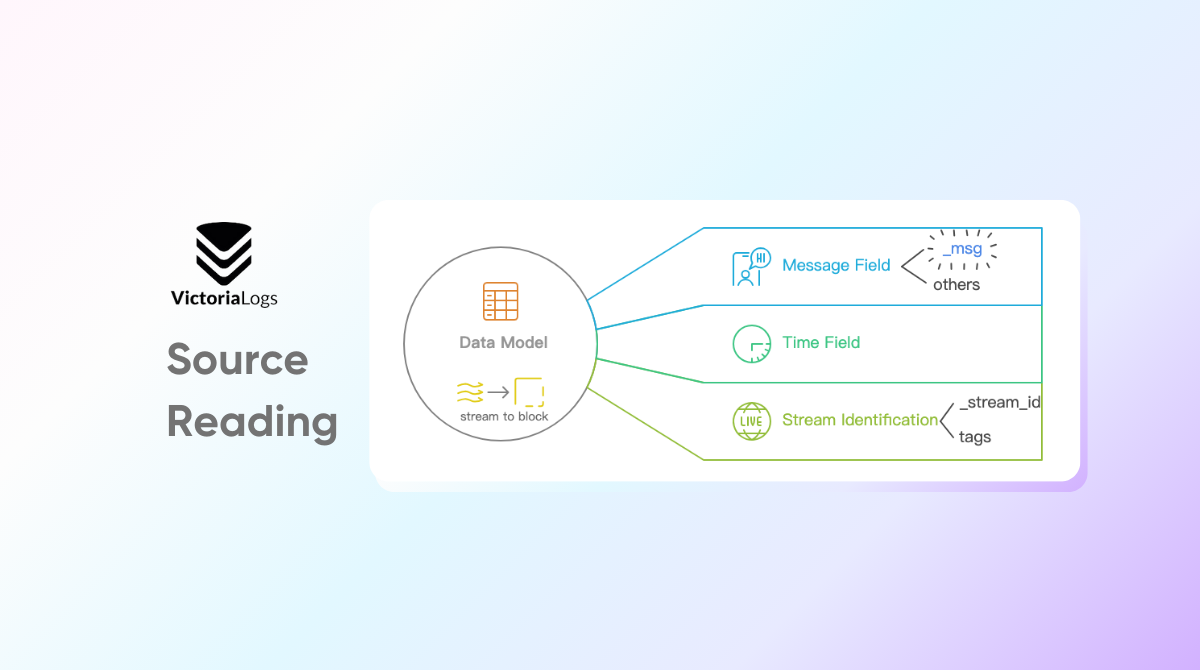
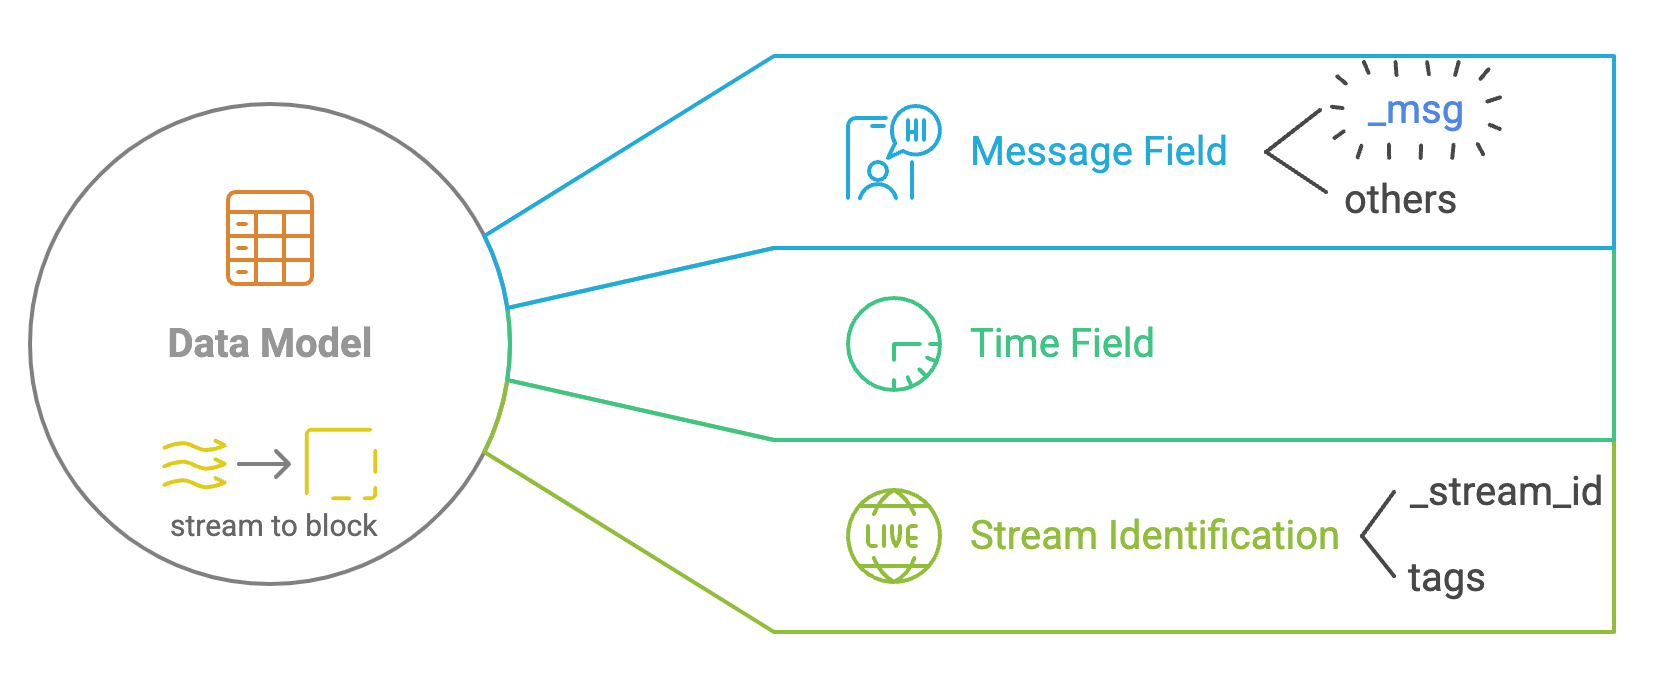
Data Model:
- Stream: High-level representation of a group of log data (like a stream). Stream is used to group log entries logically. - Block: Data representation within streams. A stream is divided into blocks for efficient storage and retrieval. - Field: A field in log entries, like the column of data. Fields can be further divided into “Message Field”, “Time Field” and “Stream Field”.
Storage:
- Partition: Data is partitioned by time range. Each partition is one day (
getPartitionForDay). First level of organizing data (and index). - DataDB: Stores log data in blocks. Works like an LSM tree.
- Part: Has
InMemoryPartandDiskPart.InMemoryPartis like memtable and will be flushed toDiskPartwhen necessary. - IndexDB: Manages indexing of log data. Based on
mergeset.
Those “words” can be found in the file system. The following is an example of the 'file structure of VictoriaLogs' data directory👇:
python
❯ ll -T victoria-logs-data

Size Name
   - victoria-logs-data
   0 ├── flock.lock
   - └── partitions
   -     └── 20250113
   -         ├── datadb
   -         │   ├── 181A232DC5D34F7D
 48M         │   │   ├── bloom.bin0
 48M         │   │   ├── bloom.bin1
  54         │   │   ├── column_names.bin
736k         │   │   ├── columns_header.bin
 78k         │   │   ├── columns_header_index.bin
136k         │   │   ├── index.bin
   0         │   │   ├── message_bloom.bin
   0         │   │   ├── message_values.bin
 250         │   │   ├── metadata.json
 110         │   │   ├── metaindex.bin
 21M         │   │   ├── timestamps.bin
110M         │   │   ├── values.bin0
437M         │   │   └── values.bin1
 210         │   └── parts.json
   -         └── indexdb
   -             ├── 181A232DC5CDBAB4
  52             │   ├── index.bin
  26             │   ├── items.bin
   8             │   ├── lens.bin
 163             │   ├── metadata.json
  51             │   └── metaindex.bin
  20             └── parts.json
Query:
- Search: A query to logstorage is called “search”.
- Tokenizer: Tokenize log entries for efficient searching and indexing.
- Filter: Various filters (e.g., time range, string match, regex) are used to narrow down log entries.
- Pipe: Advanced processing after filtering.
- BloomFilter: Helps quickly check the existence of log entries to accelerate queries.
A LogsQL example:
plaintext
_time:5m log.level:error -app:(buggy_app OR foobar) | delete host, app | stats count() errorsUtilities:
- ChunkedAllocator: Allocates memory in chunks to reduce overhead.
- Encoding: Handles encoding and decoding of log data.
- Hasher: Provides hashing functions for log entries.
- Parser: Parses log entries and queries.
Storage
In the storage part, we’ll cover how the ingest request is handled, how the data is stored, and how to maintain related structures.
Ingest
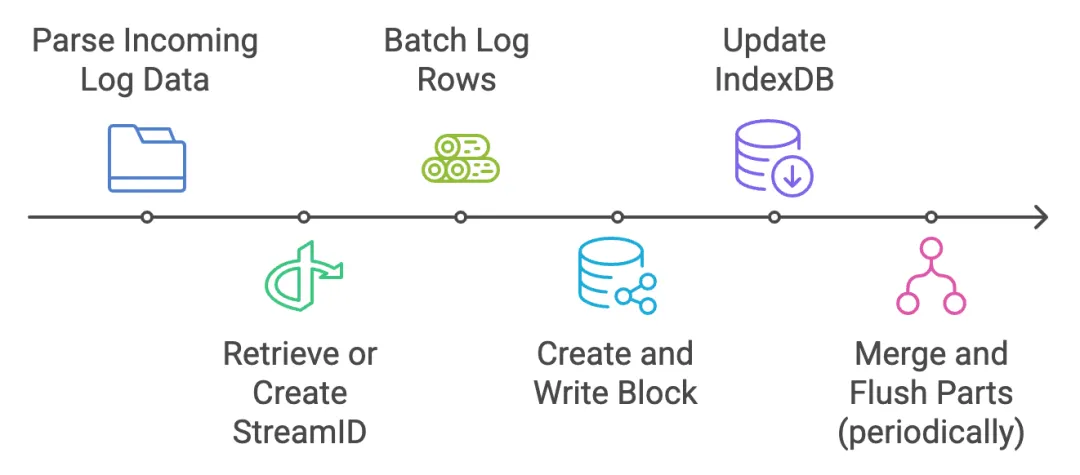
The incoming log data is parsed to identify the tenant, stream tags, timestamp, etc. The log data is represented as the following:
go
// LogRows holds a set of rows needed for Storage.MustAddRows
//
// LogRows must be obtained via GetLogRows()
type LogRows struct {
        streamIDs []streamID
        timestamps []int64
    // Field is key-value pairs
        rows [][]Field

    // streamFields contains names for stream fields
        streamFields map[string]struct{}
        // ignoreFields contains names for log fields, which must be skipped during data ingestion
        ignoreFields map[string]struct{}
        // extraFields contains extra fields to add to all the logs at MustAdd().
        extraFields []Field
        // extraStreamFields contains extraFields, which must be treated as stream fields.
        extraStreamFields []Field

    // ...omitted
}
streamID is a unique identifier for a stream, and can be used to locate the stream in the indexdb or in filter by user. streamID is generated by hashing the stream tags and tenant id in the MustAdd method. Technically, streamID can be generated outside of VictoriaLogs.
Log rows are batched into an in-memory part that can’t be searched. Each LogRows will be converted to an inmemoryPart. Once the batch is large enough, or enough time has passed, a block is created and written to disk (mustWriteTo). blockStreamWriter is responsible for this, along with its associated index structures (blockHeader, etc.) and bloom filters.
indexdb is updated to make sure every streamID is registered in the indexdb (via mustRegisterStream) so subsequent queries can locate the new data.
Periodically, these in-memory parts are merged and flushed to long-term storage for efficient querying. This is done by datadb.
Above is the rough process of handling ingest requests. On the protocol side, VictoriaLogs supports mainstream protocols like Grafana Loki, jsonline, Elasticsearch, OpenTelemetry, syslog, etc. Agents (log collector) like Fluent Bit, Logstash, Fluentd, and Vector can be used to send logs to VictoriaLogs.
Storage - Block
block is the physical abstraction of log data. There is another “block” in storage which is similar to this one (as well as indexdb), but they are different structures. Like block in logstorage is used to store string log data, and the indexdb in storage doesn’t have a concept of “stream”. The hierarchy of related concepts is like this: block <- part <- partition.
Some basic information about block, many of them are inherited from part:
- Log entries from the same stream are packed together into the same blocks.
- Each block contains columns covering unique field names across logs (horizontally partitioned).
- Smaller blocks are automatically merged into bigger blocks in the background.
- Blocks exceeding size limits are split into multiple smaller blocks.
- Partition: data is partitioned by time range.
A block (in-memory representation) is simply defined as:
go
// block represents a block of log entries.
type block struct {
    // timestamps contains timestamps for log entries.
    timestamps []int64
    // columns contains values for fields seen in log entries.
    columns []column
    // constColumns contains fields with constant values across all the block entries.
    constColumns []Field
}
On generating a block, the log entries are encoded and stored in file-system. In this step, some “encoding” is applied:
- Data will be encoded using some specific types (integer, float, ipv4, timestamp). This is dynamically probed from log content.
- String encoding is similar to Arrow BytesArray: a number array to record length, and a byte array to store the string content.
- General compression like zstd is also applied on the marshaled binary data.
Other structures like bloom filter, and index are also generated together and stored in the same directory.
Storage - IndexDB
Victorialogs maintains an LSM (merge set) for stream metadata. Provides accurate point get and filter on stream id (akin to time-series).
go
func (idb *indexdb) searchStreamIDs(tenantIDs []TenantID, sf *StreamFilter) []streamID {}StreamFilter is a simple filter condition on tags (_stream:{...}).
Storage - Cache
logstorage maintains a very simple cache implementation to store streamID, and supports filterStream for quick access. InMemoryParts can also be treated as cache, but it’s more like a buffer for data from disk and we won’t cover them here.
The cache struct is a double-buffering map defined as follows:
go
type cache struct {
    curr atomic.Pointer[sync.Map]
    prev atomic.Pointer[sync.Map]
    stopCh chan struct{}
    wg     sync.WaitGroup
}curr&prev: Atomic pointers to the cache (sync.Map).stopCh&wg: for graceful shutdown (yes this cache is not just a pure “algorithm”)
The system will periodically clean the cache to swap the current and previous caches. The clean method simply swaps the current and previous caches. I’m very curious about the performance of this implementation compared to the traditional LRU cache. I can almost assert it would be faster, but wondering by how much. I recall a similar thing which is written for simplicity and performance.
On querying, it will first try to find in the curr cache, then the prev cache. And finally indexdb if the cache misses.
This cache is a small piece among caches. There are many other in-place caches in the system, like metadata of a block, bloom filter to evaluating filters etc. Those are also simply in-memory maps.
Query
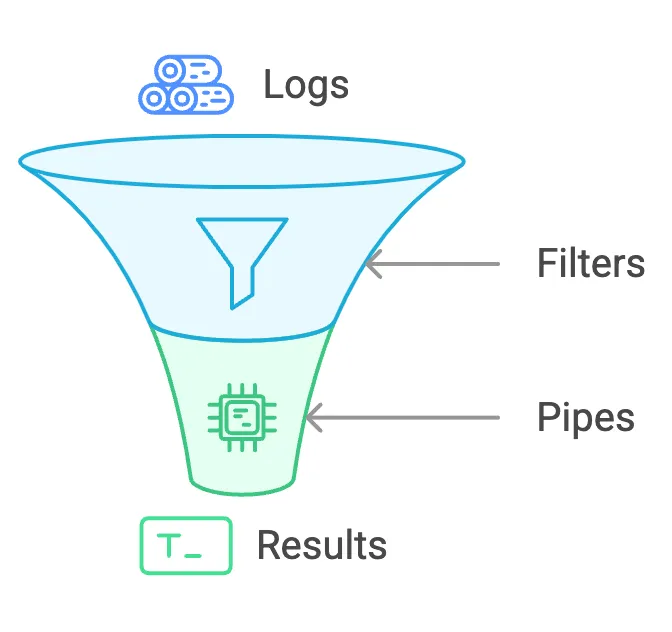
At a high level, its capabilities can be grouped into filters (ways to locate logs of interest) and pipes (ways to transform or process the results).
Filters: These are building blocks for narrowing down log messages based on specific criteria (e.g., time ranges, word matches, field values). Filters include time filters, word/phrase/prefix filters, stream filters, range filters, etc.
Pipes: Once filters have selected some logs, pipes let you transform or process these results. Some examples include:
sort by (_time)to reorder logs chronologically,limit <N>to retrieve only the top N results,statsto compute aggregate metrics like counts over the filtered logs.
Query - Filter
There are various filter mechanisms to efficiently query and filter log entries.
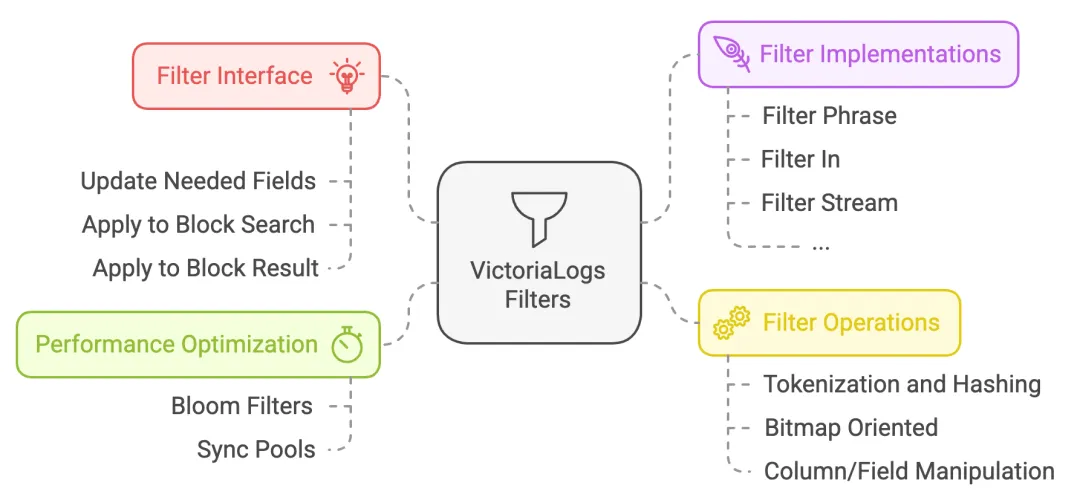
The interface is defined as follows:
go
// filter must implement filtering for log entries.
type filter interface {
    // String returns string representation of the filter
    String() string
    // updateNeededFields must update neededFields with fields needed for the filter
    updateNeededFields(neededFields fieldsSet)
    // applyToBlockSearch must update bm according to the filter applied to the given bs block
    applyToBlockSearch(bs *blockSearch, bm *bitmap)
    // applyToBlockResult must update bm according to the filter applied to the given br block
    applyToBlockResult(br *blockResult, bm *bitmap)
}
applyToBlockSearch and applyToBlockResult have similar logic. On querying, filters are applied to stored data via applyToBlockSearch, which will generate an initial filter result. Then, if there is any pipe operation, applyToBlockResult may be called (based on the implementation) to do a post-filtering.
Filters work by first evaluating at block level with bloom filter to omit blocks quickly, then examining each log entries in one block and set the result to bitmap, which is used to indicate whether a log entry is matched or not.
Query - Pipes
In LogSQL, an example of using pipes is as follows:
sql
_time:5m error | sort by (_time) desc | limit 10 | stats count()Some key takeaways about Pipes:
- Run after all filters (except the
filterpipe which can perform post-filtering) - Push mode in execution
- Filter “pushes” result to pipe processors, at block level
- Pipe processors “push” their intermediate result to the next pipe
- Collect all data at the final collector.
- Interface
- Interfaces of
pipeandpipeProcessorare very simple, and can be simplified to some kinds of function pointer.
- Interfaces of
Among various pipes, the stat pipe is an exception in the aspect of complexity. It can be treated as the third major concept in log search, with the pipe type. It is some kind of “UDAF” for computing log entries. Common computation like min(), count(), uniq() (unique) or quantile() are supported out-of-the-box.
Both pipe and stat are easy to extend. A major part of query features will be implemented in these forms. Log queries usually don’t need complex computation or relation like in generic SQL, so this framework could cover a great part of the requirements.
Misc
JSON
- VictoriaLogs automatically transforms multi-level (nested) JSON into single-level JSON during data ingestion through a systematic flattening process.
- Nested dictionaries are flattened by joining keys with a dot (.) character. (e.g.:
host.os.version) - Arrays, numbers, and boolean values are converted to strings.
Pool anywhere
go
type tokenizer struct {
    m map[string]struct{}
}

func getTokenizer() *tokenizer {
    v := tokenizerPool.Get()
    if v == nil {
        return &tokenizer{
            m: make(map[string]struct{}),
        }
    }
    return v.(*tokenizer)
}

func putTokenizer(t *tokenizer) {
    t.reset()
    tokenizerPool.Put(t)
}
Arena
arena is used for efficient memory allocation, are cached to avoid the overhead of repeatedly creating and destroying these objects. In the major source of small allocation (query processing), arena is used among 13 pipe processors (30+ in total) and other misc structs like reader, intermediate result, codec, etc.
Reference
- CTO’s overview slides about VL in 2023.05: https://www.slideshare.net/slideshow/victorialogs-previewpdf/257033587
- Repository: VictoriaMetrics’ main repository and the logstorage dir: https://github.com/VictoriaMetrics/VictoriaMetrics, https://github.com/VictoriaMetrics/VictoriaMetrics/tree/master/lib/logstorage
- Key Concepts chapter from VictoriaLogs docs: https://docs.victoriametrics.com/victorialogs/keyconcepts/
- LogsQL reference: https://docs.victoriametrics.com/victorialogs/logsql/
About Greptime
Greptime offers industry-leading time series database products and solutions to empower IoT and Observability scenarios, enabling enterprises to uncover valuable insights from their data with less time, complexity, and cost.
GreptimeDB is an open-source, high-performance time-series database offering unified storage and analysis for metrics, logs, and events. Try it out instantly with GreptimeCloud, a fully-managed DBaaS solution—no deployment needed!
The Edge-Cloud Integrated Solution combines multimodal edge databases with cloud-based GreptimeDB to optimize IoT edge scenarios, cutting costs while boosting data performance.
Star us on GitHub or join GreptimeDB Community on Slack to get connected.


