On this page
Introduction: The value of read/write separation
In time series database scenarios, read and write operations often present obvious workload differences: high-frequency write index collection and complex analysis queries coexist.
GreptimeDB achieves physical isolation through Frontend node grouping:
- Write node group: focuses on processing high-throughput write requests.
- Read node group: carries complex query loads and supports memory acceleration and index prefetching.
- Traffic isolation: avoids performance jitter caused by resource competition and improves SLA guarantee level.
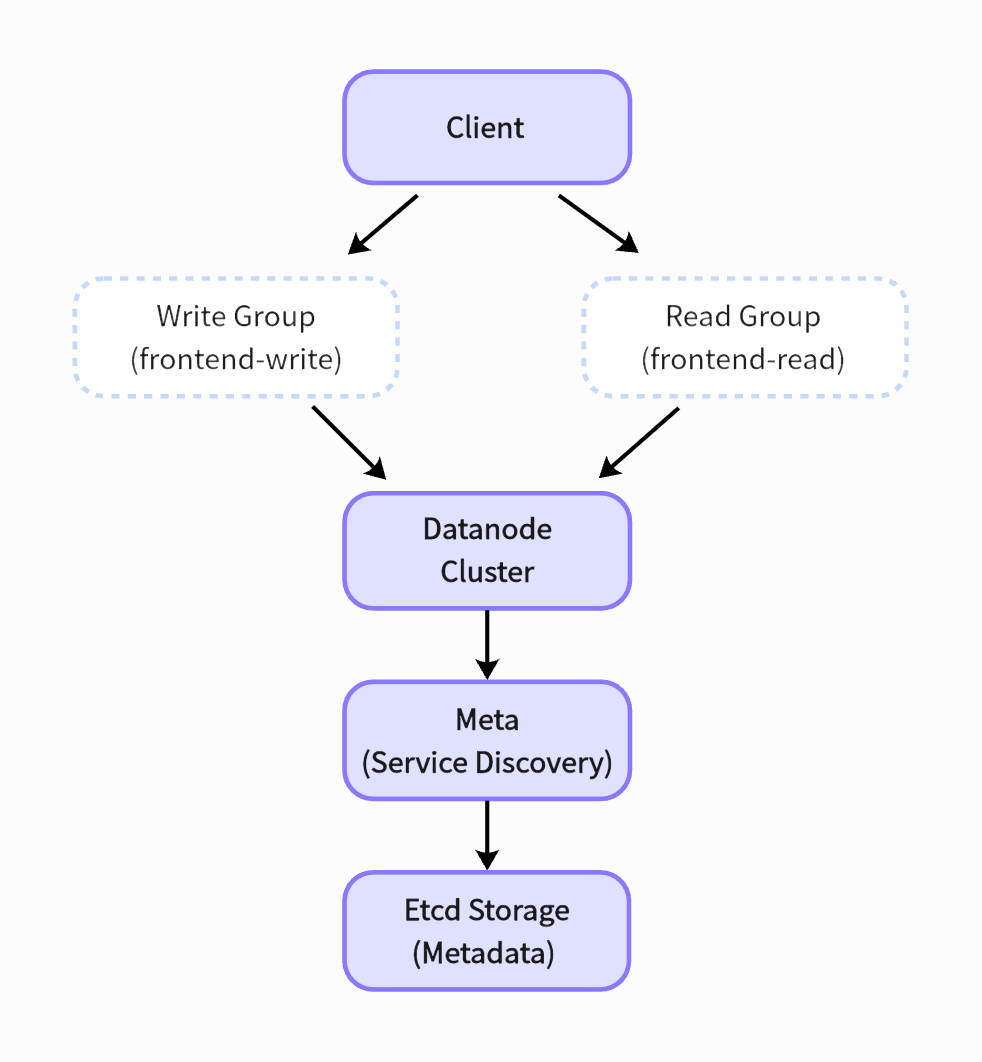
Component Description:
- Frontend node group: responsible for SQL parsing and request routing
- Write Group: undertakes write operations such as
INSERT/CREATE - Read Group: handles read operations such as
SELECT/JOIN
- Datanode cluster: distributed storage engine, using column storage + time slicing
- Meta cluster: service discovery and topology management, built-in failover mechanism
- Etcd: Persistent storage of cluster metadata
This architecture achieves linear scalability by separating read/write paths, and with the elastic scheduling features of Kubernetes, the number of replicas in each node group can be dynamically adjusted to cope with fluctuations.To optimize the processing of complex queries, read node groups can be further divided to separate requests such as long-range historical data queries and alarm queries.
This article will provide a detailed guide on how to use Helm Chart to deploy a GreptimeDB cluster with read/write separation Frontend nodes on Kubernetes.
Through step-by-step demonstrations, users will master skills such as Helm environment configuration, etcd storage deployment, Operator management of GreptimeDB clusters, and complete the read/write verification of GreptiemDB clusters.
This solution optimizes load distribution through a read-write separation design, making it suitable for large-scale time series data processing scenarios.
Environment Preparation
1. Configure the Helm Chart tool
Install the required Helm tools according to the installation documentation. Before deploying the application, add the [greptime repository](https://github.com/GreptimeTeam/helm-charts) to Helm, which contains a series of available Helm Charts.
Use the following command to add the greptime repository to Helm:
bash
helm repo add greptime https://greptimeteam.github.io/helm-charts/
helm repo update
Execute the following command to browse the available Helm Charts:
bash
helm search repo greptime --devel -lComponent Deployment
2.1 Install etcd
Perform a high-availability etcd cluster installation (it is recommended to deploy at least 3 nodes in the production environment):
bash
helm upgrade \
  --install etcd oci://registry-1.docker.io/bitnamicharts/etcd \
  --set replicaCount=3 \
  --set auth.rbac.create=false \
  --set auth.rbac.token.enabled=false \
  --create-namespace \
  -n etcd-cluster
Check the deployment status of etcd:
bash
kubectl get po -n etcd-cluster
NAME                     READY   STATUS      RESTARTS   AGE
etcd-0                   1/1     Running     0          4m15s
etcd-1                   1/1     Running     0          4m15s
etcd-2                   1/1     Running     0          4m15s
etcd-pre-upgrade-5rmcf   0/1     Completed   0          32d
2.2 Install greptimedb-operator
Ensure that the greptimedb-operator mirrored version you are using is higher than or equal to v0.2.1-alpha.1, and the Helm Chart version is higher than or equal to 0.2.18:
bash
helm upgrade \
  --install \
  --create-namespace \
  greptimedb-operator greptime/greptimedb-operator \
  -n greptimedb-admin
Check the installation status of greptimedb-operator:
bash
kubectl get po -n greptimedb-admin
NAME                                  READY   STATUS    RESTARTS   AGE
greptimedb-operator-57b65f775-mjjs9   1/1     Running   0          19s
2.3 Install greptimedb-cluster
Before installing the GreptimeDB cluster, you need to create a configuration file greptimedb-values.yaml with the following content:
yaml
image:
  registry: docker.io
  repository: greptime/greptimedb
  tag: "v0.13.0"

initializer:
  registry: docker.io
  repository: greptime/greptimedb-initializer
  tag: v0.2.1-alpha.1

frontends:
  - name: read
    replicas: 1

  - name: write
    replicas: 1

meta:
  replicas: 1
  etcdEndpoints: "etcd.etcd-cluster.svc.cluster.local:2379"

datanode:
  replicas: 1

frontend:
  enabled: false
Install GreptimeDB cluster:
bash
helm upgrade \
  --install greptimedb \
  greptime/greptimedb-cluster \
  -n default \
  --values greptimedb-values.yaml
Check the installation status of greptimedb-cluster:
bash
kubectl get po -n default
NAME                                        READY   STATUS    RESTARTS   AGE
greptimedb-datanode-0                       1/1     Running   0          19s
greptimedb-frontend-read-57d56c5b57-659qh   1/1     Running   0          13s
greptimedb-frontend-write-f5765fbcc-pbcm2   1/1     Running   0          13s
greptimedb-meta-5645bf97d6-vksdg            1/1     Running   0          7m37s
bash
kubectl get service -n default
NAME                        TYPE        CLUSTER-IP      EXTERNAL-IP   PORT(S)                               AGE
greptimedb-datanode         ClusterIP   None            <none>        4001/TCP,4000/TCP                     6m21s
greptimedb-frontend-read    ClusterIP   10.96.224.187   <none>        4001/TCP,4000/TCP,4002/TCP,4003/TCP   5m3s
greptimedb-frontend-write   ClusterIP   10.96.126.53    <none>        4001/TCP,4000/TCP,4002/TCP,4003/TCP   5m3s
greptimedb-meta             ClusterIP   10.96.180.218   <none>        3002/TCP,4000/TCP                     12m
Read/write Test
3.1 Port Forwarding Configuration
Establish an access channel for read and write nodes: Forward the MySQL port of the read Frontend node to the local port 6002, and forward the MySQL port of the write Frontend node to the local port 7002👇
bash
kubectl port-forward svc/greptimedb-frontend-read -n default 6002:4002 > connections.out &
kubectl port-forward svc/greptimedb-frontend-write -n default 7002:4002 > connections.out &
3.2 Write Data
Connect to write Frontend node:
bash
mysql -h 127.0.0.1 -P 7002sql
mysql> CREATE TABLE monitor (
    ->   host STRING,
    ->   ts TIMESTAMP DEFAULT CURRENT_TIMESTAMP() TIME INDEX,
    ->   cpu FLOAT64 DEFAULT 0,
    ->   memory FLOAT64,
    ->   PRIMARY KEY(host));
Query OK, 0 rows affected (0.15 sec)
sql
mysql> INSERT INTO monitor
    -> VALUES
    ->     ("127.0.0.1", 1702433141000, 0.5, 0.2),
    ->     ("127.0.0.2", 1702433141000, 0.3, 0.1),
    ->     ("127.0.0.1", 1702433146000, 0.3, 0.2),
    ->     ("127.0.0.2", 1702433146000, 0.2, 0.4),
    ->     ("127.0.0.1", 1702433151000, 0.4, 0.3),
    ->     ("127.0.0.2", 1702433151000, 0.2, 0.4);
Query OK, 6 rows affected (0.08 sec)
3.3 Read Data
Connect to read Frontend node:
bash
mysql -h 127.0.0.1 -P 6002sql
mysql> select * from monitor;
+-----------+---------------------+------+--------+
| host      | ts                  | cpu  | memory |
+-----------+---------------------+------+--------+
| 127.0.0.1 | 2023-12-13 02:05:41 |  0.5 |    0.2 |
| 127.0.0.1 | 2023-12-13 02:05:46 |  0.3 |    0.2 |
| 127.0.0.1 | 2023-12-13 02:05:51 |  0.4 |    0.3 |
| 127.0.0.2 | 2023-12-13 02:05:41 |  0.3 |    0.1 |
| 127.0.0.2 | 2023-12-13 02:05:46 |  0.2 |    0.4 |
| 127.0.0.2 | 2023-12-13 02:05:51 |  0.2 |    0.4 |
+-----------+---------------------+------+--------+
6 rows in set (0.07 sec)
Production Recommendations
- Topology expansion: dynamically adjust
datanode.replicasandfrontends[*].replicasaccording to the load;- Storage Configuration: Mount Persistent Volumes (PVCs) for datanodes
- Monitoring integration: Integrate with Prometheus to collect
greptimedb-cluster-metrics metrics;- Network optimization: Use LoadBalancer type services for load balancing. For the full deployment sample code, see the GreptimeDB Helm Charts repository.
Summary: GreptimeDB cluster deployment
We have carried out a complete practice, covering environment configuration, dependency component installation, GreptimeDB cluster deployment, and data read/write testing. We deployed GreptimeDB cluster on Kubernetes using Helm Chart and configured Frontend nodes for read/write separation.
In practice, users can adjust the number of nodes and parameter configurations based on requirements to further improve the performance and availability of GreptimeDB.
About Greptime
Greptime offers industry-leading time series database products and solutions to empower IoT and Observability scenarios, enabling enterprises to uncover valuable insights from their data with less time, complexity, and cost.
GreptimeDB is an open-source, high-performance time-series database offering unified storage and analysis for metrics, logs, and events. Try it out instantly with GreptimeCloud, a fully-managed DBaaS solution—no deployment needed!
The Edge-Cloud Integrated Solution combines multimodal edge databases with cloud-based GreptimeDB to optimize IoT edge scenarios, cutting costs while boosting data performance.
Star us on GitHub or join GreptimeDB Community on Slack to get connected.


