On this page
Observability 2.0 is a concept introduced by Charity Majors of Honeycomb, though she later expressed reservations about labeling it as such(follow-up).
Despite its contested naming, Observability 2.0 represents an evolution from the foundational "three pillars" of observability, metrics, logs, and traces, which have dominated the field for nearly a decade. Instead, it emphasizes a single source of truth paradigm as a data foundation of observability. This approach prioritizes high-cardinality, wide-event datasets over traditional siloed telemetry, aiming to address modern system complexity more effectively.
What is Observability 2.0 and Wide Events
For years, observability has relied on the three pillars of metrics, logs, and traces. These pillars spawned countless libraries, tools, and standards—including OpenTelemetry, one of the most successful cloud-native projects, which is built entirely on this paradigm. However, as systems grow in complexity, the limitations of this approach become evident.
The Downsides of Traditional Observability
- Data silos: Metrics, logs, and traces are often stored separately, leading to uncorrelated, or even inconsistent, data without meticulous management.
- Pre-aggregation trade-offs: Pre-aggregated metrics (counters, summaries, histograms) were originally designed to reduce storage costs and improve performance by sacrificing granularity. However, the rigid structure of time-series data limits the depth of contextual information, forcing teams to generate millions of distinct time-series to capture necessary details. Ironically, this practice now incurs exponentially higher storage and computational costs—directly contradicting the approach’s original purpose.
- Unstructured logs: While logs inherently contain structured data, extracting meaning requires intensive parsing, indexing, and computational effort.
- Static instrumentation: Tools rely on predefined queries and thresholds, limiting detection to 'known knowns'. Adapting observability requires code changes, forcing it to align with slow software development cycles.
- Redundant data: Identical information is duplicated across metrics, logs, and traces, wasting storage and increasing overhead.
Wide Events: The Approach of Observability 2.0
Observability 2.0 addresses these issues by adopting wide events as its foundational data structure. Instead of precomputing metrics or structuring logs upfront, it preserves raw, high-fidelity event data as the single source of truth. This allows teams to perform exploratory analysis retroactively, deriving metrics, logs, and traces dynamically from the original dataset.
Boris Tane, in his article Observability Wide Event 101, defines a wide event as a context-rich, high-dimensional, and high-cardinality record. For example, a single wide event might include:
json
{
  "method": "POST",
  "path": "/articles",
  "service": "articles",
  "outcome": "ok",
  "status_code": 201,
  "duration": 268,
  "requestId": "8bfdf7ecdd485694",
  "timestamp":"2024-09-08 06:14:05.680",
  "message": "Article created",
  "commit_hash": "690de31f245eb4f2160643e0dbb5304179a1cdd3",
  "user": {
    "id": "fdc4ddd4-8b30-4ee9-83aa-abd2e59e9603",
    "activated": true,
    "subscription": {
      "id": "1aeb233c-1572-4f54-bd10-837c7d34b2d3",
      "trial": true,
      "plan": "free",
      "expiration": "2024-09-16 14:16:37.980",
      "created": "2024-08-16 14:16:37.980",
      "updated": "2024-08-16 14:16:37.980"
    },
    "created": "2024-08-16 14:16:37.980",
    "updated": "2024-08-16 14:16:37.980"
  },
  "article": {
    "id": "f8d4d21c-f1fd-48b9-a4ce-285c263170cc",
    "title": "Test Blog Post",
    "ownerId": "fdc4ddd4-8b30-4ee9-83aa-abd2e59e9603",
    "published": false,
    "created": "2024-09-08 06:14:05.460",
    "updated": "2024-09-08 06:14:05.460"
  },
  "db": {
    "query": "INSERT INTO articles (id, title, content, owner_id, published, created, updated) VALUES ($1, $2, $3, $4, $5, $6, $7);",
    "parameters": {
      "$1": "f8d4d21c-f1fd-48b9-a4ce-285c263170cc",
      "$2": "Test Blog Post",
      "$3": "******",
      "$4": "fdc4ddd4-8b30-4ee9-83aa-abd2e59e9603",
      "$5": false,
      "$6": "2024-09-08 06:14:05.460",
      "$7": "2024-09-08 06:14:05.460"
    }
  },
  "cache": {
    "operation": "write",
    "key": "f8d4d21c-f1fd-48b9-a4ce-285c263170cc",
    "value": "{\"article\":{\"id\":\"f8d4d21c-f1fd-48b9-a4ce-285c263170cc\",\"title\":\"Test Blog Post\"..."
  },
  "headers": {
    "accept-encoding": "gzip, br",
    "cf-connecting-ip": "*****",
    "connection": "Keep-Alive",
    "content-length": "1963",
    "content-type": "application/json",
    "host": "website.com",
    "url": "https://website.com/articles",
    "user-agent": "Mozilla/5.0 (X11; Linux x86_64) AppleWebKit/537.36",
    "Authorization": "********",
    "x-forwarded-proto": "https",
    "x-real-ip": "******"
  }
}
Wide events contain significantly more contextual data than traditional structured logs, capturing comprehensive application state details. When stored in an observability data store, these events serve as a raw dataset from which teams can compute any conventional metric post hoc. For instance:
- QPS (queries per second) for a specific API path.
- Response rate distributions by HTTP status code.
- Error rates filtered by user region or device type.
This process requires no code changes—metric are derived directly from the raw event data through queries, eliminating the need for pre-aggregation or prior instrumentation.
For practical implementations, see:
Challenges of Observability 2.0 Adoption
Traditional metrics and logs were designed to prioritize resource efficiency: minimizing compute and storage costs. For example, Prometheus employs a semi-key-value data model to optimize time-series storage, akin to the early NoSQL era: just as developers moved relational database workloads to Redis (counters, sorted sets, lists) for speed and simplicity, observability tools adopted pre-aggregated metrics and logs to reduce overhead.
However, like the shift to Big Data in software engineering, the move from the "three pillars" to wide events reflects a growing need for raw, granular data over precomputed summaries. This transition introduces key challenges:
- Event generation: Lack of mature frameworks to instrument applications and emit standardized, context-rich wide events.
- Data transport: Efficiently streaming high-volume event data without bottlenecks or latency.
- Cost-effective storage: Storing terabytes of raw, high-cardinality data affordably while retaining query performance.
- Query flexibility: Enabling ad-hoc analysis across arbitrary dimensions (e.g., user attributes, request paths) without predefining schemas.
- Tooling integration: Leveraging existing tools (e.g., dashboards, alerts) by deriving metrics and logs retroactively from stored events, not at the application layer.
What shapes the database for observability 2.0
As Charity Majors notes in her recent blog post, observability is evolving toward a data lake model. While wide events simplify data modeling by acting as a single source of truth, they demand infrastructure designed to address the challenges outlined earlier.
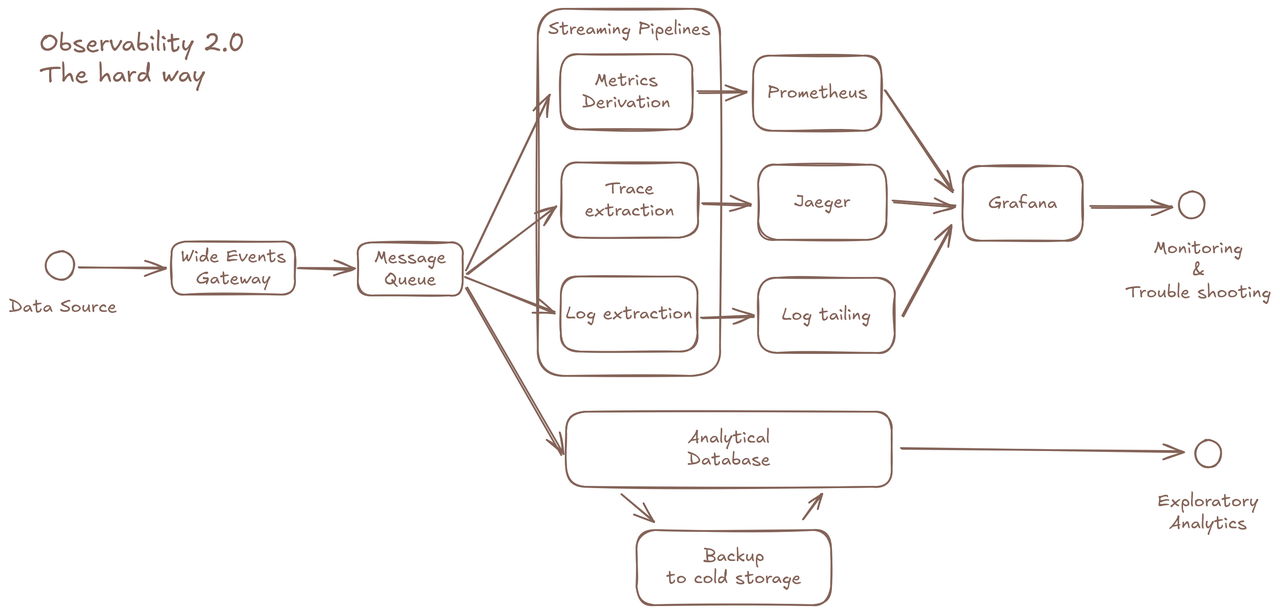
Adopting Observability 2.0 aims to maximize raw data utility without prohibitive complexity. While technically possible to cobble together a solution using:
- OLAP databases for raw event storage.
- Pre-processing pipelines for derived metrics/traces.
- Separate metric stores for dashboards.
- Trace stores for distributed tracing APIs.
- Backup systems for cold data. …this fragmented approach undermines the core promise of Observability 2.0. Instead, the paradigm demands a dedicated database optimized for its unique workload.
Let’s walk through key factors that define the database requirements for Observability 2.0:
Making good usage of commodity storage and data format
- Disaggregated architecture, cloud object storage
- Columnar data format for compression and performance
As demonstrated in Boris Tane’s example, a single uncompressed wide event can exceed 2KB in size. For high-throughput microservice-based applications, this introduces a multiplier effect on storage demands—especially when retaining data long-term for continuous analysis (e.g., training AI models or auditing historical trends).
The database must leverage cloud-based object storage (e.g., AWS S3, Google Cloud Storage) for cost efficiency and scalability. Ideally, it should automate data tiering between local and cloud storage with minimal management overhead—embodying the disaggregated compute and storage architecture, where storage scales independently of compute resources.
Columnar data formats (e.g., Apache Parquet, Arrow) are critical for reducing storage costs. By storing values from the same field sequentially, they enable custom encoding (e.g., dictionary encoding, run-length encoding) to compress data at rest. Additionally, columnar formats are inherently optimized for analytical queries, as they allow efficient column pruning and vectorized processing.
Realtime, scalable and elastic
- Low latency on query as well as data visibility
- The ingestion rate can scale with site traffic
Due to their pre-aggregated nature, traditional metrics don't scale as your traffic increases unless you spin up numerous new instances. This makes capacity planning for metrics stores more straightforward. However, with wide events serving as a single source of truth, observability data is generated per-request, meaning your observability 2.0 infrastructure must be as scalable and elastic as your application. To scale properly in modern cloud environments, databases must be designed carefully, keeping state contained within minimal scope and establishing clear separation of responsibilities for each type of node.
Your data has to be ingested and query-able in realtime to fulfill the needs for realtime use-cases like dashboards and alerting.
Flexible query capabilities
- The database has to handle Observability 1.0 queries, as well as analytical queries.
- Metrics need to be derived from wide events, within the database.
An Observability 2.0 database must support two types of queries: routine queries (for dashboards and alerts) and exploratory queries (for ad-hoc analysis).
Removing metrics as first-class citizens does not eliminate the need for pre-aggregation: it simply shifts this responsibility from the application layer to the database. Users still require fast access to known-knowns (e.g., error rates, latency thresholds) via dashboards or alerts, which demands efficient processing of routine queries. However, this becomes challenging with high-dimensional data. To address this, the database must support:
- Flexible indexing strategies
- Pre-processing capabilities
- Incremental computation (e.g., updating aggregates without reprocessing entire datasets)
Additionally, the database must handle exploratory analytics, which enables uncovering "unknown unknowns" through offline, long-term analysis. These queries are often unpredictable, spanning large datasets and extended time ranges. Ideally, the database should execute them without degrading performance for routine queries or ingestion. While users could offload this workload to a dedicated OLAP database, the added latency and cost of data duplication create friction, undermining Observability 2.0’s goal of unified, real-time insights.
Backward-compatible to observability 1.0
- We still need Grafana dashboards
We already have robust dashboards, visualizations, and alert rules from Observability 1.0. Transitioning to wide events does not require abandoning these tools or rebuilding from scratch.
A DSL like PromQL remains well-suited for time-series dashboards compared to SQL. The advantage now is that complex PromQL queries become unnecessary, thanks to the clear separation between routine queries (optimized for dashboards/alerts) and exploratory analytics. Crucially, high cardinality should no longer be a systemic limitation of the observability database.
Trace views and log tailing functionality must remain accessible through the new backend. All established best practices from Observability 1.0—such as alert thresholds, dashboard conventions, and trace analysis workflows—should be preserved and enhanced, not discarded.
That's how we built GreptimeDB
GreptimeDB is the open-source analytical observability database built for wide events and o11y 2.0 practice. We designed it to work seamlessly with modern cloud infrastructure, and provide our user efficient, one-stop and handy experience on observability data management.
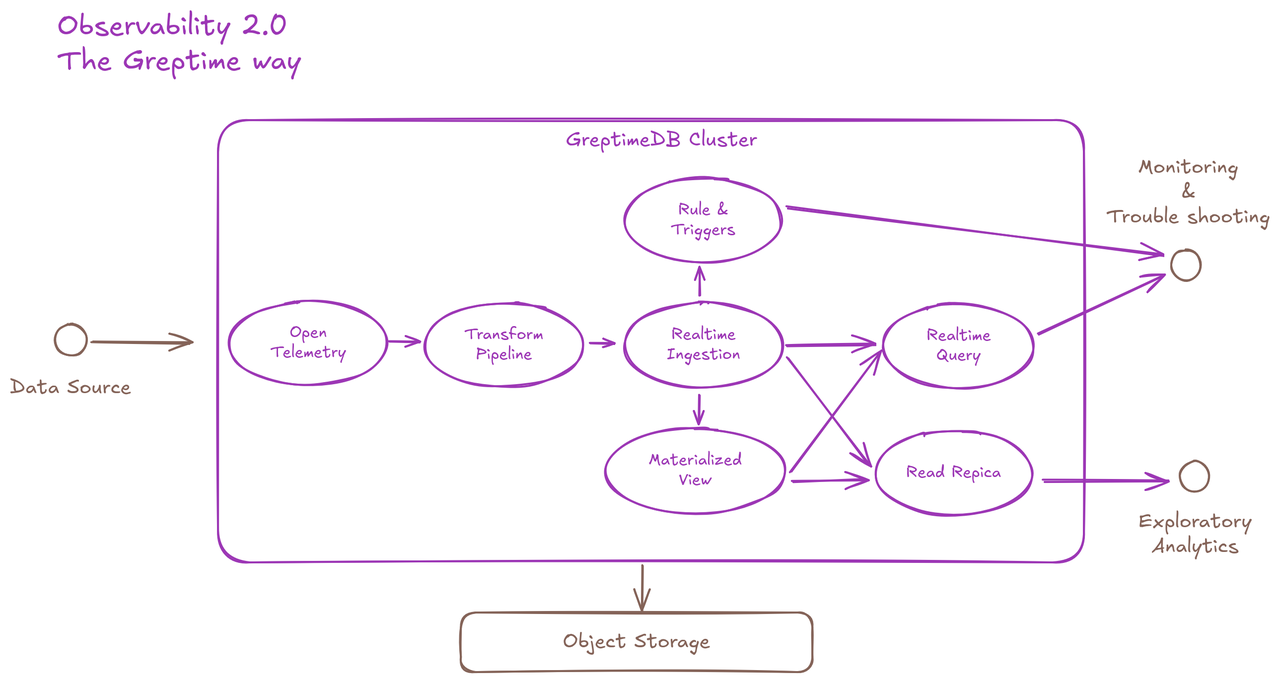
This logical flow chart describes key features of GreptimeDB that fits observability 2.0 data lifecycle:
- Accept incoming data in OpenTelemetry format
- Built-in transform engine to pre-process data
- High-throughput realtime data ingestion
- Realtime query API
- Materialized view for data derivation
- Read-replicas for isolated analytical queries
- Built-in rule engine and trigger mechanisms for push-based notification
- Object storage for data persistence
Conclusion
We believe raw data based approach will transform how we use observability data and extract value from it. GreptimeDB is committed to be the open source infrastructure that helps you to archive it progressively.
Start your journey with GreptimeDB today and unlock the future of observability, one event at a time.
About Greptime
GreptimeDB is an open-source, cloud-native database purpose-built for real-time observability. Built in Rust and optimized for cloud-native environments, it provides unified storage and processing for metrics, logs, and traces—delivering sub-second insights from edge to cloud —at any scale.
GreptimeDB OSS – The open-sourced database for small to medium-scale observability and IoT use cases, ideal for personal projects or dev/test environments.
GreptimeDB Enterprise – A robust observability database with enhanced security, high availability, and enterprise-grade support.
GreptimeCloud – A fully managed, serverless DBaaS with elastic scaling and zero operational overhead. Built for teams that need speed, flexibility, and ease of use out of the box.
🚀 We’re open to contributors—get started with issues labeled good first issue and connect with our community.


