
On this page
Background: Challenges in Frontend Observability
Poizon is a leading platform that combines trusted e-commerce with youth-oriented lifestyle content. With strict product authentication and centralized fulfillment, it supports large-scale transactions of sneakers, streetwear, and collectibles. These business demands generate massive data volumes and require high-performance infrastructure—especially for monitoring and system observability.
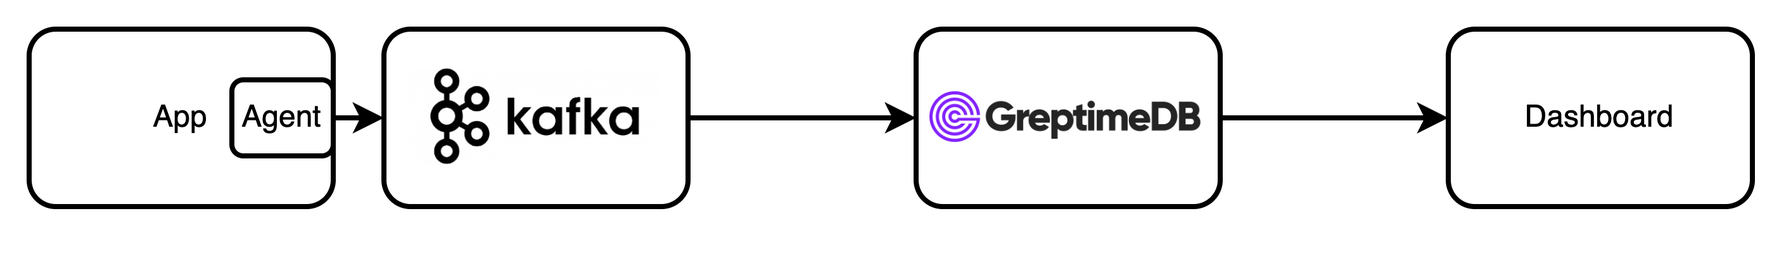
In observability scenarios, it's crucial to monitor real-time behavior across multiple geographic regions and environments to ensure application reliability and performance. Traditional architectures often rely on multi-stage pipelines, such as Agent ➞ Message Queue ➞ Stream Engine ➞ OLAP Store to collect, process and store metrics and traces. While effective for basic data ingestion and querying, these systems face several challenges:
1. Complex Layered Architecture
Supporting aggregating observerbility data to different time granularities (e.g., 10s, 1m, 1h, 1d) often requires building separate pipelines and materialized views, leading to redundant compute and storage resource usage. Optimizing this through techniques like incremental materialization is essential for improving resource efficiency.
2. Balancing Performance and Cost in Complex Analytics
Advanced use cases like full-table joins and multidimensional cross-analysis can cause exponential cost spikes during high-traffic events (e.g., flash sales). Strategies like pre-computation acceleration, intelligent tiered storage, and elastic resource allocation can offer cost-performance gains.
3. Production-Grade Security and Governance
The SQL-driven development model increases agility but raises the bar for enterprise data governance. Features like SQL validation, partition-level protection, and audit logs are critical for reducing operational risk and improving governance maturity.
A GreptimeDB-Based Observability Platform
This case study outlines how Poizon migrated its frontend observability analytics stack to GreptimeDB, using its native Flow engine to implement continuous roll-ups across multiple time resolutions (10s, 1m, 10m). By leveraging advanced data structures like HyperLogLog and UDDsketch, Poizon achieved high-performance, low-cost, and maintainable monitoring.
System Architecture Overview
The new architecture centers around GreptimeDB and its built-in Flow engine to manage multi-granularity downsampling (second, minute, hourly) via declarative SQL pipelines, dramatically simplifying view maintenance and reducing operational overhead.
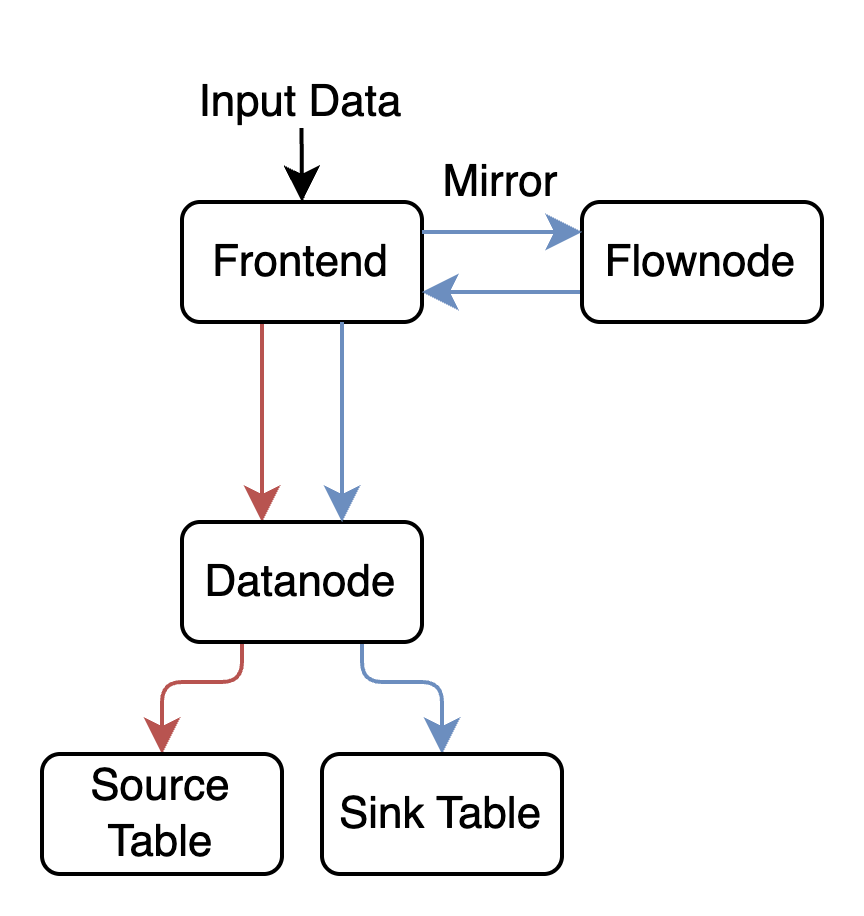
GreptimeDB Distributed Architecture
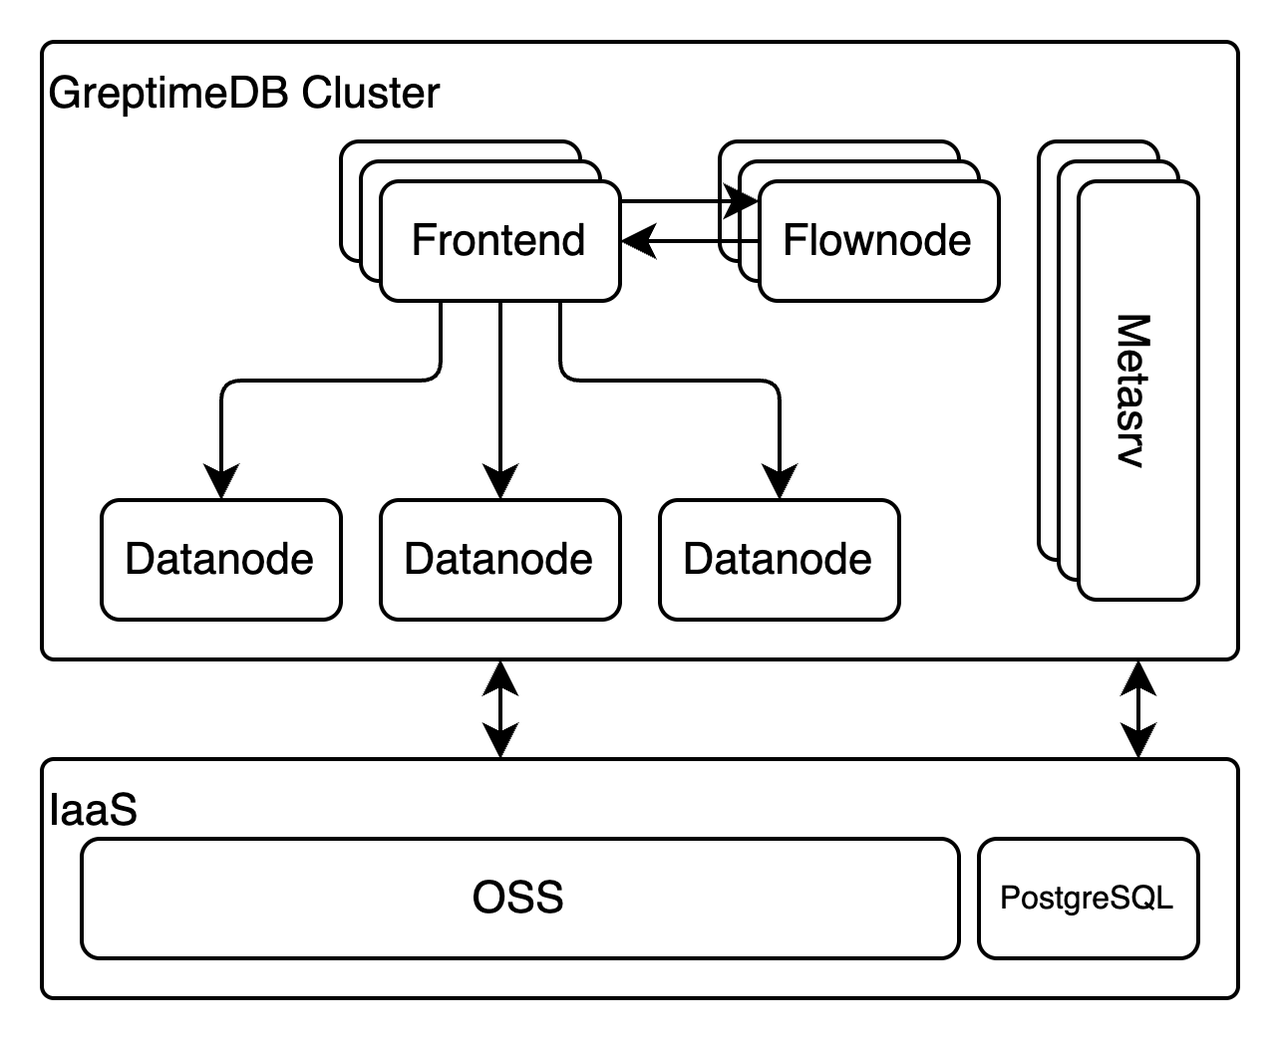
- Frontend: Stateless query gateway responsible for request handling, authentication, and basic statement planning.
- Datanode: Manages data shards, handles ingestion, executes queries.
- Flownode: Executes streaming tasks triggered by write traffic mirrored from the Frontend.
- Metasrv: Stateless control-plane component for cluster metadata and routing, backed by PostgreSQL.
Transparent Data Caching
GreptimeDB abstracts storage access, allowing Datanodes to treat local disks and remote object stores transparently. To mitigate latency from object storage, GreptimeDB employs a layered caching mechanism:
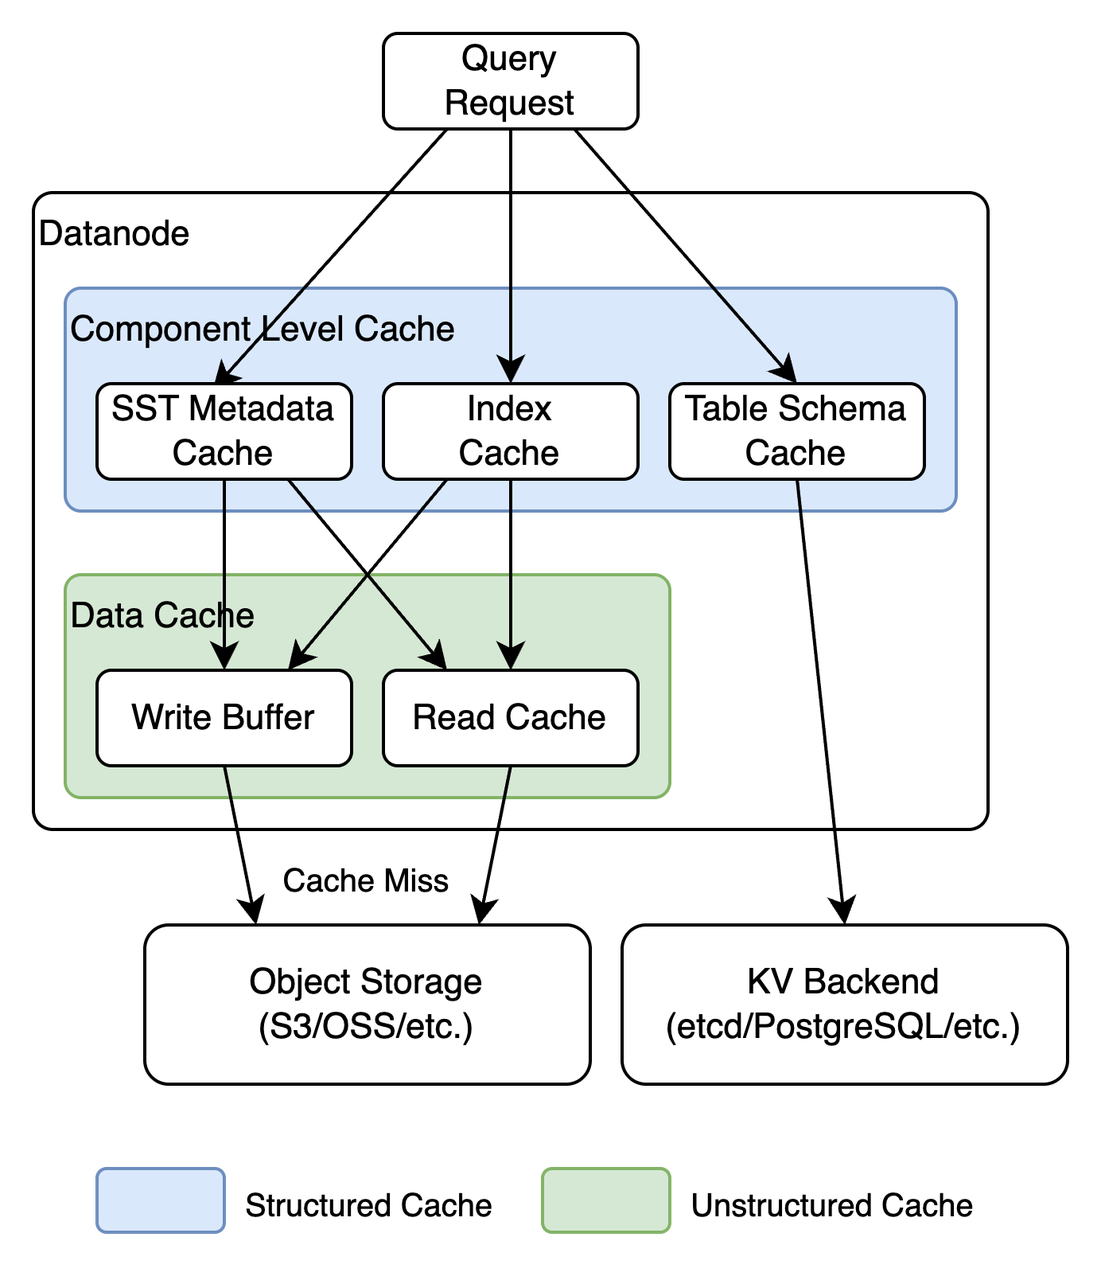
Disk Cache
Accelerates access to frequently used object store files by caching byte ranges on local disk. Includes intelligent prefetching and I/O merging.
Memory Cache
Caches deserialized metadata (e.g. bloom filters, min/max and other statistics) to accelerate query pruning. This dual-layer, structured/unstructured cache system is auto-managed by GreptimeDB and tunable via configuration settings.
Elastic Scalability
GreptimeDB's smallest read/write unit is a data shard (called "region"), which can be migrated between nodes to balance load. Region migration is manually supported in the open-source edition:
Docs: Region Migration Guide
In Kubernetes-native deployments, Metasrv collects node load and enables traffic-based scaling and routing. Poizon also leveraged Kubernetes autoscaling to achieve read-write separation.
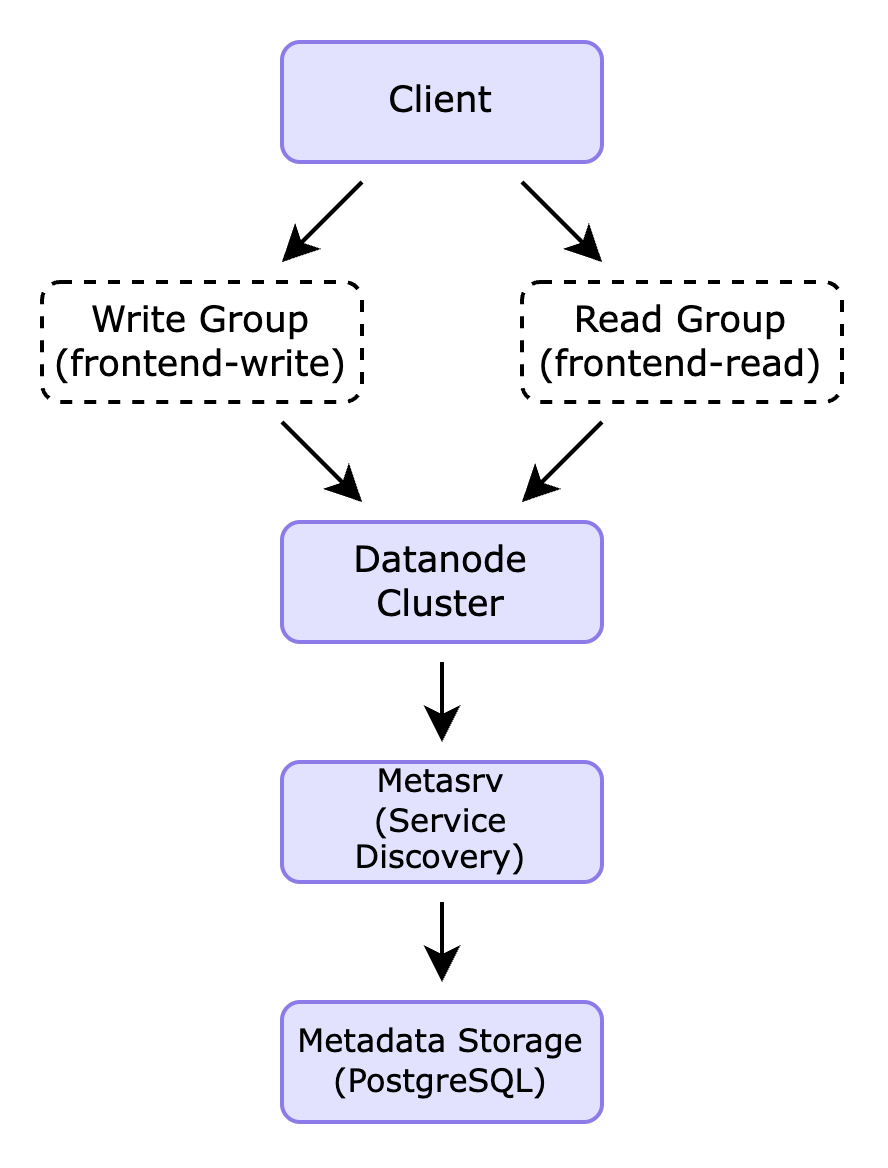
In addition, GreptimeDB is a database designed for cloud-native infrastructure. Its Metasrv node can collect the load status of each node in real time and distribute traffic accordingly. For workloads with different read and write characteristics, users can take advantage of Kubernetes' elastic scheduling capabilities to adjust the number of replicas for different node groups, thereby achieving read/write separation.
For a detailed look at how GreptimeDB implements read/write separation in practice, refer to this article.
Streaming Analytics with GreptimeDB Flow Engine
GreptimeDB Flow Engine is a lightweight, SQL-native stream processing engine tailored for time-series ETL and real-time aggregation. Ingested data is mirrored from Frontend to Flownode, processed incrementally, and persisted back.
Flow jobs are defined entirely in SQL. For example:
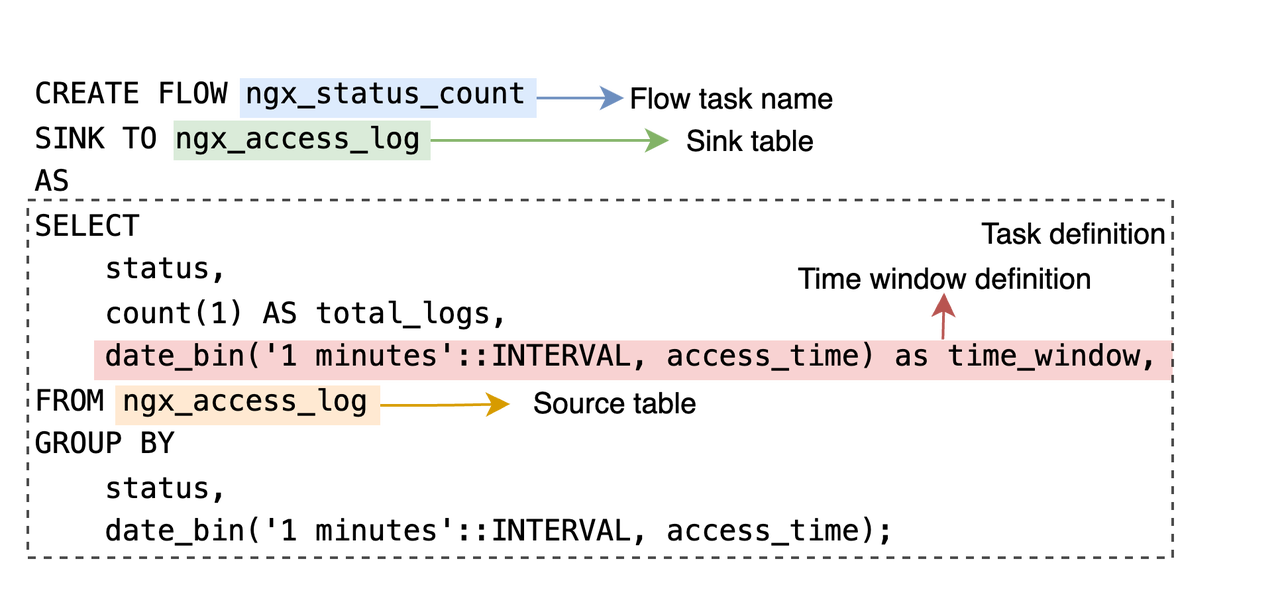
A task named ngx_status_count is defined to continuously compute the number of access logs per minute for each unique status code in the ngx_access_log table. The task definition following the AS keyword is a standard SQL statement, making it very easy to get started for developers familiar with SQL.
Multi-level Continuous Aggregation Architecture
10-second granularity hot data layer
sql
CREATE FLOW ngx_status_count
SINK TO status_count_table
EXPIRE AFTER '1 hour'::INTERVAL
AS
SELECT status, COUNT(*)
FROM ngx_access_log
GROUP BY status, date_bin('1m'::INTERVAL, timestamp);
Note: This job counts HTTP statuses per minute, using familiar SQL syntax — making it easy to adopt for developers.
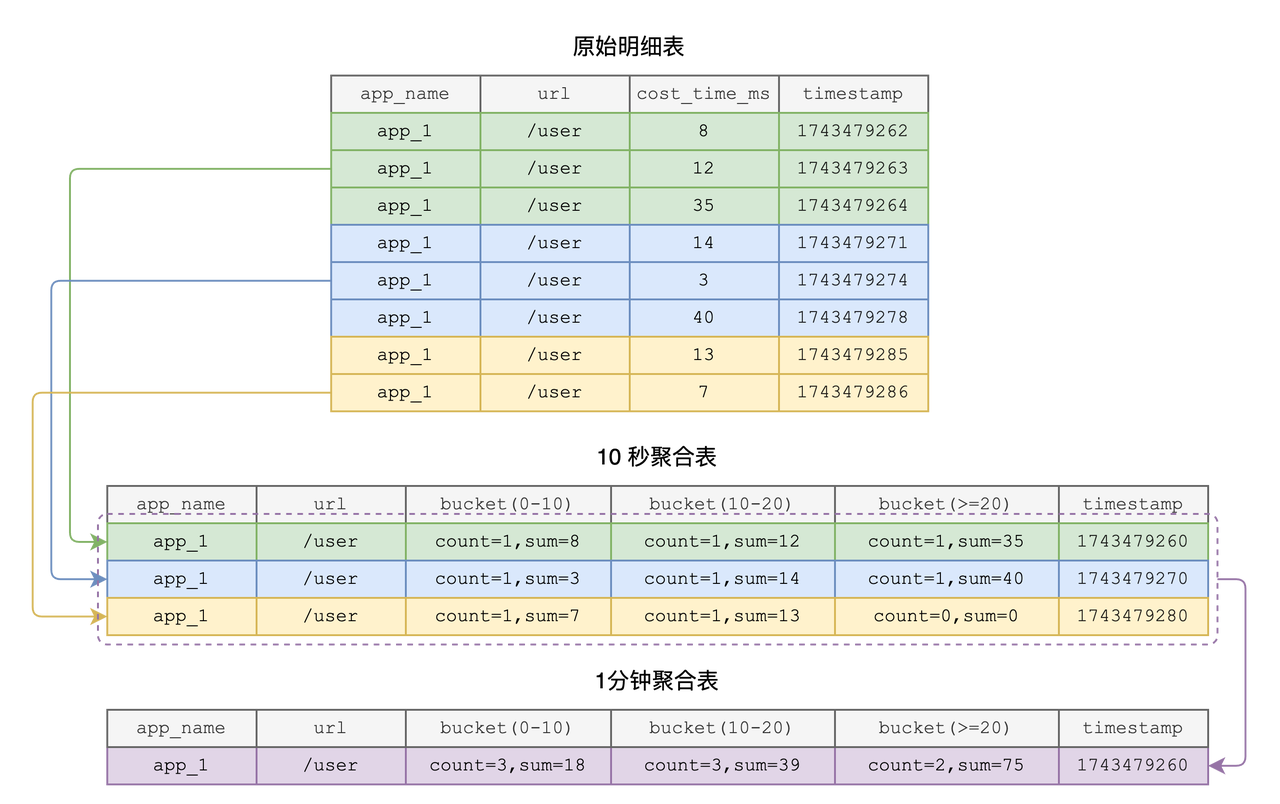
1m Granularity Mid-Level Roll-Up
sql
CREATE FLOW rpc_cost_10s
SINK TO rpc_cost_10s_agg
EXPIRE AFTER '12hours'::INTERVAL
AS
SELECT
  app_name,
  url,
  date_bin('10s'::INTERVAL, timestamp) AS time_window,
  uddsketch(cost_time_ms, 0.01, 0.001) AS cost_sketch
FROM rpc_cost_time
GROUP BY app_name, url, date_bin('10s'::INTERVAL, timestamp);
Note: Periodically merge sketches with a 10-second granularity to generate minute-level aggregates, retaining them for 30 days.
10m Granularity Cold Layer
sql
CREATE FLOW rpc_cost_10m
SINK TO rpc_cost_10m_agg
EXPIRE AFTER '180days'::INTERVAL
AS SELECT
  app_name,
  url,
  date_bin('10m'::INTERVAL, time_window_1m) AS time_window_10m,
  uddsketch_merge(cost_sketch_1m) AS cost_sketch_10m
FROM rpc_cost_1m_agg
GROUP BY app_name, url, date_bin('10m'::INTERVAL, time_window_1m);
Note: Further consolidate into 10-minute intervals, store in low-cost object storage, and retain for 180 days.
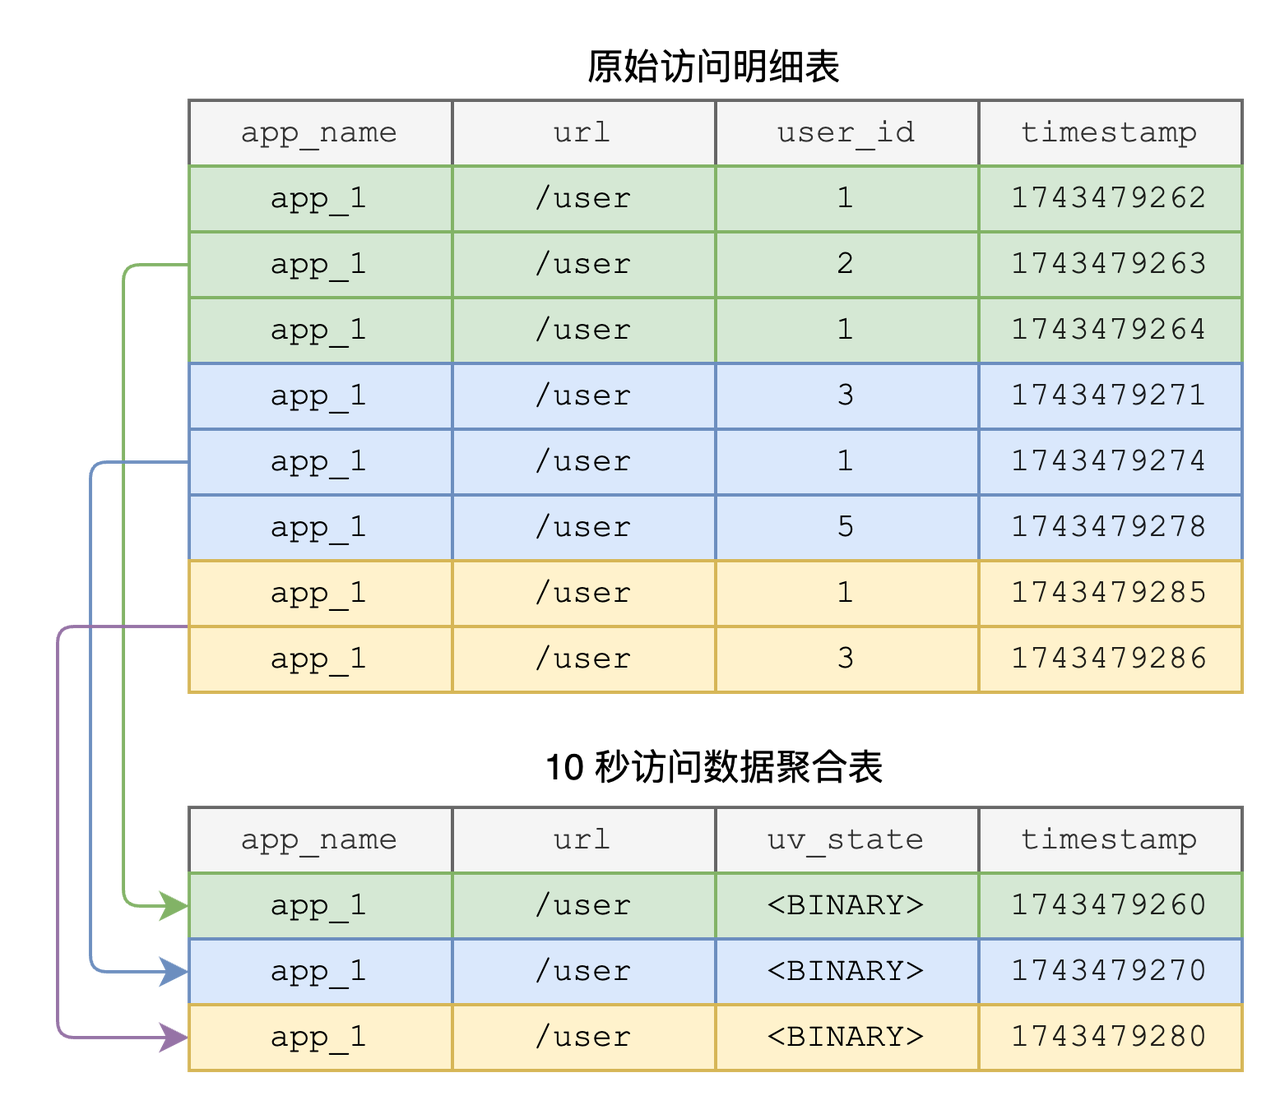
UV Approximation: HyperLogLog
Similar to latency distribution statistics, tracking the number of unique visitors (UV) for each URL over a time period is also a common requirement. However, precise UV counting for a specific time range can be computationally expensive. As a result, the industry often adopts approximate algorithms like HyperLogLog (HLL).
Starting from GreptimeDB v0.12, HLL-related functions are supported and can be combined with Flow to enable flexible and efficient UV approximation for arbitrary time windows.
10s UV State Aggregation
sql
CREATE FLOW uv_hll_10s
SINK TO uv_state_10s
EXPIRE AFTER '12hours'::INTERVAL
AS SELECT
  app_name,
  url,
  date_bin('10s'::INTERVAL, ts) AS time_window,
  hll(user_id) AS uv_state
FROM access_log
GROUP BY app_name, url, date_bin('10s'::INTERVAL, ts);hllfunction: This function hashes theuser_idvalues within the same time window and stores the result in theuv_statefield of theuv_state_10stable.uv_statefield (BINARY type): This is a binary field and cannot be queried directly. To retrieve the approximate number of unique visitors for a specific 10-second window, use thehll_countfunction:
sql
SELECT
  app_name,
  url,
  hll_count(uv_state) AS uv_count
FROM uv_state_10s
WHERE time_window = 1743479260;
1-Minute UV Roll-up Aggregation
If you need to further roll up the 10-second UV data to 1-minute intervals—or query the number of unique users over a longer period—you can use the hll_merge function to merge multiple binary HLL states:
sql
CREATE FLOW uv_hll_1m
SINK TO uv_state_1m
EXPIRE AFTER '180days'::INTERVAL
AS SELECT
  app_name,
  url,
  date_bin('1m'::INTERVAL, time_window) AS time_window_1m,
  hll_merge(uv_state) AS uv_state
FROM uv_state_10s
GROUP BY app_name, url, date_bin('1m'::INTERVAL, time_window);
Query example:
sql
SELECT
  app_name,
  url,
  hll_count(uv_state) AS uv_count
FROM uv_state_1m
WHERE time_window_1m = '2025-04-20T15:23:00Z'
GROUP BY app_name, url;
Performance and Benefits
- Significant query performance boost
Pre-aggregation + multi-level roll-up avoids full scans; P99 latency is reduced from seconds to milliseconds.
- Cost-effective storage
Different TTLs are applied at each level of granularity:
- 10s table: retained for 1 day
- 1m aggregation table: 7 days
- 10m aggregation table: 180 days
This hot/cold data separation reduces overall storage cost.
- Decoupled resources and elastic scaling
Frontend, Flownode, and Datanode can scale independently. Stream processing, storage, and query operations do not interfere with each other.
- Improved developer productivity
Flow tasks are written using standard SQL, with a low learning curve. Built-in functions like roll-up, HyperLogLog, and UDDsketch require no extra effort to use.
Best Practices and Deployment Recommendations with GreptimeDB
- Layered data modeling: Design retention and granularity strategies based on SLA and monitoring use cases.
- Adjust sketch precision:
UDDsketchsupports customizable error bounds (α,βparameters), which can be tuned according to business needs for P50/P99 accuracy. - Monitoring and alerting: Set up retry and alerting mechanisms for each aggregation layer to ensure the reliability of continuous computation.
- Resource planning: Estimate the number of
FlownodesandDatanodesbased on write QPS and aggregation complexity. Design partitioning schemes accordingly, considering the bandwidth of the object storage system.
Poizon's adoption of GreptimeDB not only streamlined its observability architecture but also validated new time-series processing paradigms such as Wide Events. With high-performance streaming, native SQL aggregation, and Kubernetes-native scaling, GreptimeDB emerges as a strong choice for modern monitoring systems.
For teams facing similar scalability, cost, and observability challenges, GreptimeDB offers a powerful and developer-friendly path forward.
About Greptime
GreptimeDB is an open-source, cloud-native database purpose-built for real-time observability. Built in Rust and optimized for cloud-native environments, it provides unified storage and processing for metrics, logs, and traces—delivering sub-second insights from edge to cloud —at any scale.
GreptimeDB OSS – The open-sourced database for small to medium-scale observability and IoT use cases, ideal for personal projects or dev/test environments.
GreptimeDB Enterprise – A robust observability database with enhanced security, high availability, and enterprise-grade support.
GreptimeCloud – A fully managed, serverless DBaaS with elastic scaling and zero operational overhead. Built for teams that need speed, flexibility, and ease of use out of the box.
🚀 We’re open to contributors—get started with issues labeled good first issue and connect with our community.


