On this page
In day-to-day database operations, we often encounter a familiar scenario:
A user reports that a query is running too slowly, but by the time we investigate, the query has already finished, and its execution details are gone—making it impossible to pinpoint the performance bottleneck. Or we notice abnormal database load during a certain period in system monitoring, but without detailed query logs, it’s difficult to trace which SQL/PromQL statements actually caused the problem.
Starting with GreptimeDB v0.15 (with v0.16.0 already available at the time of writing—users are encouraged to upgrade), a new feature was introduced: the slow query system table greptime_private.slow_queries. With just a few configurations, GreptimeDB can automatically capture and record slow queries. This provides DBAs and developers with a convenient diagnostic and analysis tool. Whether for post-incident troubleshooting or for ongoing performance monitoring, historical slow query records make it easy to quickly locate the root cause.
Enabling Slow Query Logging
Slow query logging can be enabled with the following configuration:
yaml
[slow_query]
enable = true
record_type = "system_table"
threshold = "10s"
sample_ratio = 1.0
ttl = "30d"enable— set totrueto turn on slow query logging.record_type— determines how queries are recorded:log: output only to logs.system_table: store in the system tablegreptime_private.slow_queries(recommended).
threshold— the time threshold for slow queries. Any query exceeding this will be logged. For example,1h= 1 hour,1m= 1 minute. In this case, set to 10 seconds.sample_ratio— sampling ratio. For environments with high query volume, you can reduce overhead by sampling. Here, 1.0 means all slow queries are recorded.ttl— retention period for records inslow_queries. Default is 30 days.
Note: In standalone mode, enabling this configuration is sufficient. In cluster deployments, it must be enabled on Frontend nodes.
Enable Slow Query Logging (Standalone)
First, follow the standalone installation guide. You can deploy either with binaries or using Docker.
Download the sample configuration file and save it as standalone.toml:
bash
curl -o standalone.toml \
https://raw.githubusercontent.com/GreptimeTeam/greptimedb/refs/tags/v0.16.0/config/standalone.example.toml
Edit the [slow_query] section, uncomment it, and enable slow query logging:
toml
## The slow query log options.
[slow_query]
## Whether to enable slow query log.
enable = true

## The record type of slow queries. It can be `system_table` or `log`.
## @toml2docs:none-default
record_type = "system_table"

## The threshold of slow query.
## @toml2docs:none-default
threshold = "10s"

## The sampling ratio of slow query log. The value should be in the range of (0, 1].
## @toml2docs:none-default
sample_ratio = 1.0
Start GreptimeDB with the updated config file -c:
bash
./greptime standalone start -c standalone.tomlOr, using Docker:
bash
docker run -p 127.0.0.1:4000-4003:4000-4003 \
  -v "$(pwd)/greptimedb_data:/greptimedb_data" \
  -v "$(pwd)/standalone.toml:/standalone.toml" \
  --name greptime --rm \
  greptime/greptimedb:v0.16.0 standalone start \
  --http-addr 0.0.0.0:4000 \
  --rpc-bind-addr 0.0.0.0:4001 \
  --mysql-addr 0.0.0.0:4002 \
  --postgres-addr 0.0.0.0:4003 \
  -c /standalone.toml
Note: We explicitly specify MySQL and HTTP ports here, as the default config listens on
127.0.0.1, which is inaccessible outside the container. Overriding with0.0.0.0makes them available externally.
Enable Slow Query Logging (Cluster)
For clusters, we recommend deploying with Helm Charts (see cluster deployment guide.
Create a values.yaml file:
yaml
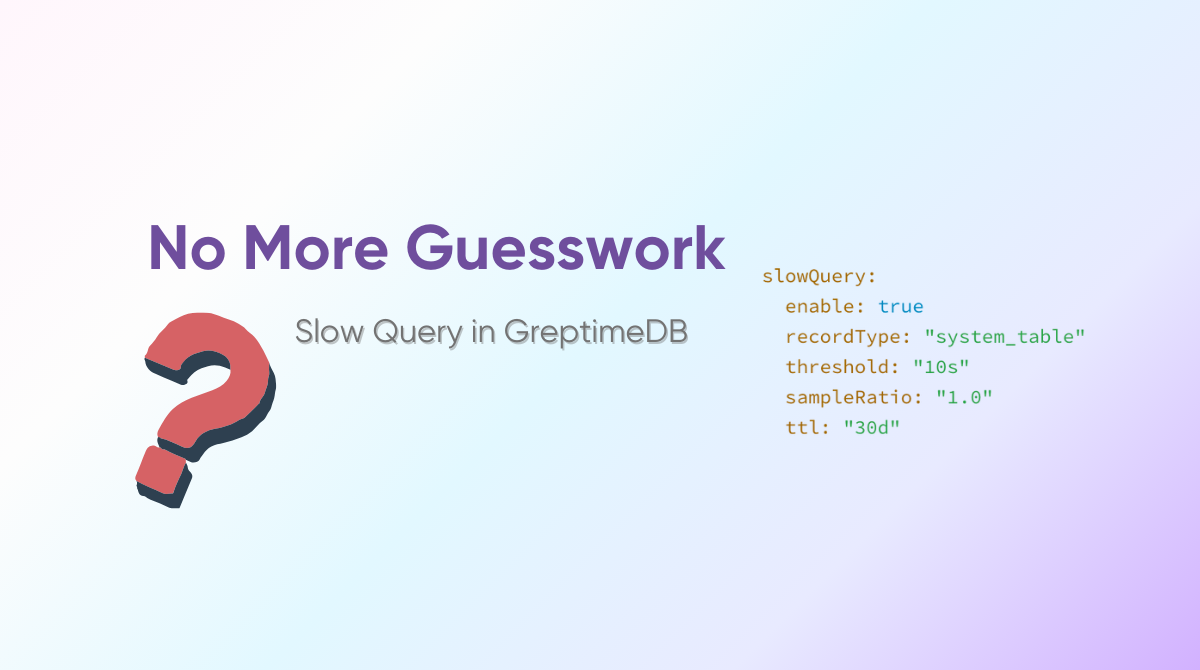
slowQuery:
  enable: true
  recordType: "system_table"
  threshold: "10s"
  sampleRatio: "1.0"
  ttl: "30d"
Deploy the cluster:
bash
helm install mycluster \
  greptime/greptimedb-cluster \
  -f values.yaml \
  -n default
Check that all pods are running:
bash
kubectl -n default get podsThe output will be:
bash
NAME                                 READY   STATUS    RESTARTS   AGE
mycluster-datanode-0                 1/1     Running   0          70s
mycluster-flownode-0                 1/1     Running   0          33s
mycluster-frontend-f8989595d-bm2pf   1/1     Running   0          39s
mycluster-meta-6964f7b654-mdp6q      1/1     Running   0          106s
Forward the Frontend service to access the cluster:
bash
kubectl -n default port-forward svc/mycluster-frontend 4000:4000 4001:4001 4002:4002 4003:4003Confirm the configuration with the /config API:
bash
curl -sS http://localhost:4000/config | grep slow_query -A5The output will be:
bash
[slow_query]
enable = true
record_type = "system_table"
threshold = "10s"
sample_ratio = 1.0
ttl = "30d"
Verifying Slow Query Logging
To test, connect via MySQL client on port 4002:
bash
mysql -h 127.0.0.1 -P 4002Run a deliberately slow query:
sql
WITH RECURSIVE slow_cte AS (
    SELECT 1 as n, md5(random()) as hash
    UNION ALL
    SELECT n + 1, md5(concat(hash, n))
    FROM slow_cte
    WHERE n < 1000000
)
SELECT COUNT(*) FROM slow_cte;
This query uses a recursive CTE to iterate from 1 to 1,000,000, computing a new MD5 at each step based on the previous hash, and finally counts the total number of generated rows.
This query takes over 1 min on the author's machine:
sql
+----------+
| count(*) |
+----------+
|  1000000 |
+----------+
1 row in set (1 min 0.42 sec)
Query the slow query system table greptime_private.slow_queries:
sql
SELECT * FROM greptime_private.slow_queries\G;
Sample output:
*************************** 1. row ***************************
        cost: 60394
   threshold: 10000
       query: WITH RECURSIVE slow_cte AS (SELECT 1 AS n, md5(random()) AS hash UNION ALL SELECT n + 1, md5(concat(hash, n)) FROM slow_cte WHERE n < 1000000) SELECT COUNT(*) FROM slow_cte
   is_promql: 0
   timestamp: 2025-08-20 07:07:08.300677
promql_range: 0
 promql_step: 0
promql_start: 1970-01-01 00:00:00
  promql_end: 1970-01-01 00:00:00
1 row in set (0.03 sec)

ERROR:
No query specified
GreptimeDB automatically recorded:
cost— execution time in milliseconds (in this case, >1 minute).query— the original SQL or PromQL statement.is_promqland related fields — additional metadata for PromQL queries (e.g., range, step, start, end).timestamp— when the slow query occurred (UTC timezone in this case). With this record, DBAs can further analyze the query usingEXPLAINorEXPLAIN ANALYZE.
Conclusion
The slow query logging feature in GreptimeDB (introduced in v0.15) makes it simple to capture and diagnose slow SQL and PromQL queries. By enabling this feature, teams gain historical visibility into query performance, making troubleshooting and monitoring significantly easier.
In GreptimeDB Enterprise Edition, this goes even further with integrated query performance analysis and optimization recommendations—all available through a visual dashboard.


