On this page
2025 is the year of Agentic AI. OpenAI's Agents SDK, Anthropic's MCP (Model Context Protocol), LangGraph, CrewAI—the toolchain for building AI Agents is maturing fast. Even more significant: the Linux Foundation just launched the Agentic AI Foundation (AAIF)[1] to drive open standards and tools for AI agents, with founding contributions from Anthropic (MCP), Block (goose), and OpenAI (AGENTS.md).
But as teams ship more agents to production, two questions keep coming up: How do you debug an agent that's misbehaving? How do you optimize one that's underperforming?
That's what Agent Observability is all about.
This space has exploded over the past year. Datadog launched AI Agent Monitoring at DASH 2025[2]. OpenTelemetry is developing GenAI Semantic Conventions[3]. Specialized platforms like LangSmith and Langfuse are gaining serious traction. All of this raises a fundamental question: Can traditional observability—the "three pillars" of Metrics, Logs, and Traces—still cut it? Or do we need something entirely new?
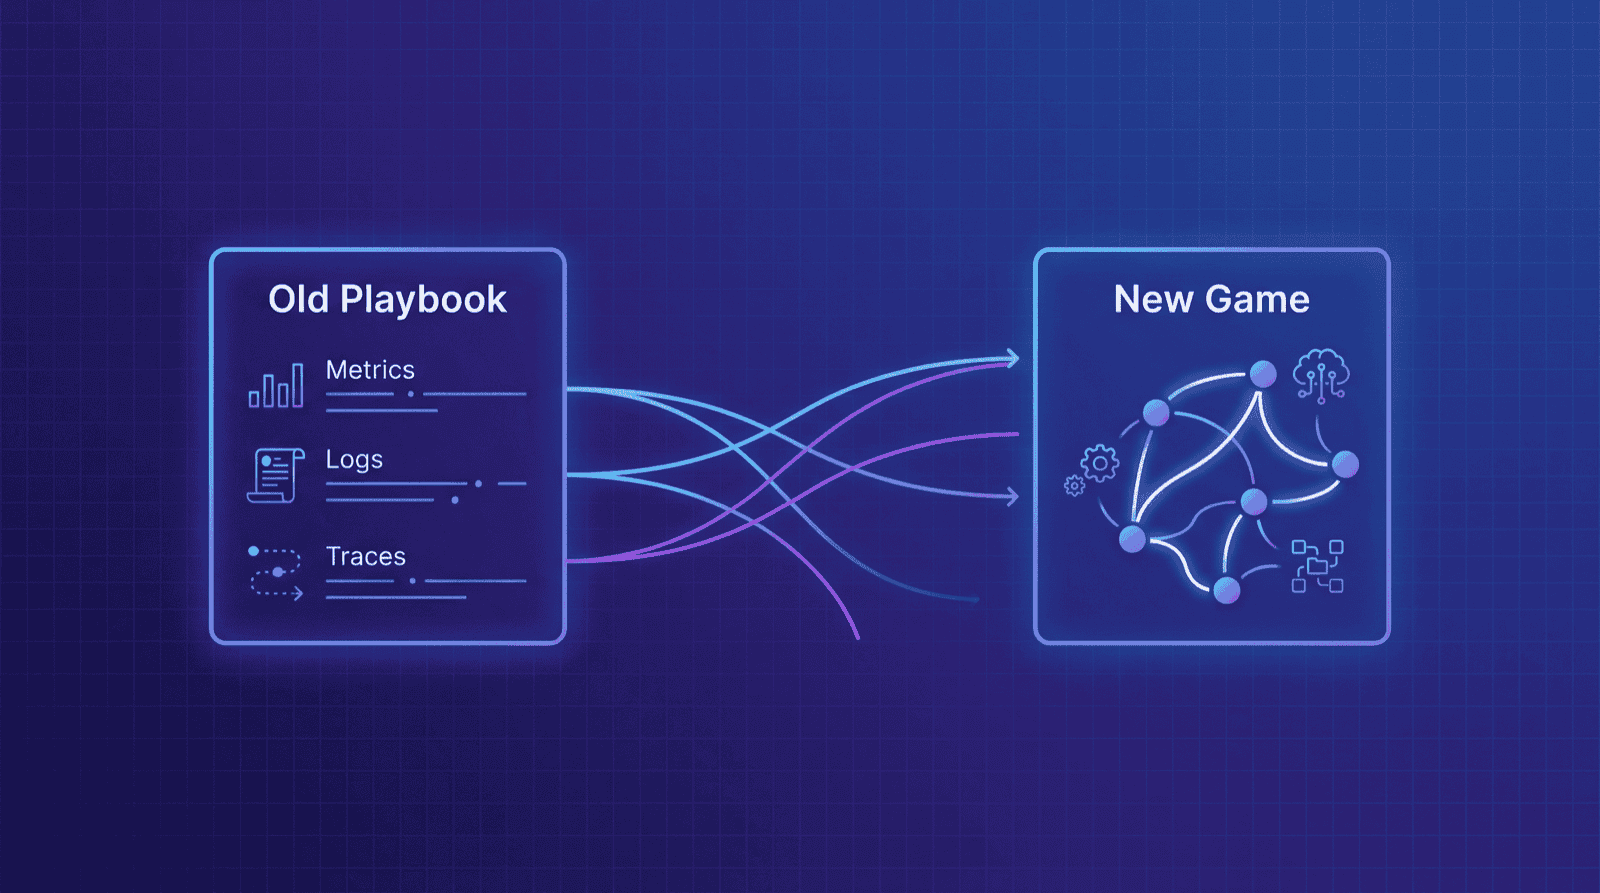
Here's our take: The old playbook still works, but it needs new plays. And when you look closely at what those new plays require, you'll see they point toward a deeper shift—Observability 2.0.
The Old Playbook: Traditional Observability Still Applies
Good news first: we don't need to throw out existing observability frameworks.
The three pillars remain valid. Agent applications still need:
- Metrics: token usage, call latency, cost tracking
- Logs: prompts, responses, tool outputs
- Traces: agent execution flows, multi-step reasoning paths
OpenTelemetry is becoming the standard for GenAI. OTel's GenAI Semantic Conventions are now part of the official spec (v1.37+), defining attributes like gen_ai.request.model, gen_ai.usage.input_tokens, and gen_ai.provider.name[4]. Platforms like Datadog and Langfuse already support these natively.
Traces are essentially a special form of structured logging. — [5]
Agent observability isn't about replacing what we have—it's about extending it.
The real question is: how far do we extend? What new capabilities do we need? That's where things get interesting. This article will explore and address these questions.
New Plays (Part 1): The Data Shape Has Changed
The Semi-Structured Data Explosion
Traditional observability deals with fairly clean data types:
- Structured Metrics: numerical time-series with fixed schemas
- Unstructured Logs: free-form text streams
- Structured Traces: span trees with clear hierarchies
Agents generate something different: massive amounts of semi-structured data.
| Data Type | What It Looks Like |
|---|---|
| Prompts | Text + template variables + system instructions + injected context |
| Tool Calls | Function names + dynamic parameters (often nested) + varied return structures |
| Memory State | Key-value pairs + complex nesting + evolving over conversations |
| Multi-turn Context | Conversation history + role identifiers + metadata |
A typical agent execution event might contain dozens or even hundreds of fields. Each tool call can return a completely different structure.
This isn't just "more data"—it's a fundamental change in data shape.
How do traditional approaches handle this? You either stuff everything into logs (losing structure, making queries painful) or force it into traces (too rigid for dynamic structures). Neither works well.
Datadog makes this point in their agent monitoring docs[6]:
Agents often maintain internal memory—such as CrewAI's short-term and long-term memory or LangGraph's state—which influences their decisions but may not be exposed in standard logs or spans.
Data Scale: How Much Observability Data Does a Typical Agent App Generate?
Let's put some numbers to this. Consider a mid-sized agent application:
Scenario assumptions:
- Daily Active Users (DAU): 100,000
- Average interactions per user per day: 5
- Average LLM calls per interaction: 3 (planning, tool calling, response generation)
Data volume estimates:
| Metric | Calculation | Value |
|---|---|---|
| Daily LLM calls | 100K × 5 × 3 | 1.5 million/day |
| Tokens per call | Input 2K + Output 1K (typical RAG scenario) | ~3K tokens |
| Daily token volume | 1.5M × 3K | 4.5 billion tokens/day |
| Size per Wide Event | 50-200 fields including prompt/response | 2-8 KB |
| Daily observability data | 1.5M × 5KB (median) | ~7.5 GB/day |
| Monthly observability data | 7.5GB × 30 | ~225 GB/month |
For large-scale applications (1M+ DAU), you're looking at 2+ TB/day.
Real-world production numbers:
- Langfuse (LLM observability platform): Handles tens of thousands of events per minute in production, with backends storing billions of rows[7]. They define small-scale deployments as under 1 million traces per month.
- Laminar (Browser Agent observability platform): Processes hundreds of thousands of browser session events daily. A bug in their SDK once triggered over 1 billion writes in a single day[8].
- ClickHouse LogHouse (internal observability platform): Stores 100+ PB of uncompressed data across nearly 500 trillion rows[9].
Key insight: Agent observability data isn't just about volume—it's about dimensionality. Honeycomb's experience shows that mature observability datasets typically have 200-500 dimensions[10]. This means traditional metrics aggregation (with predefined dimensions) fundamentally can't cover agent analysis needs.
From System Behavior to Semantic Quality
The third difference is that the observation target itself is changing.
Traditional monitoring answers questions like:
- Is the service up? ✅ / ❌
- What's the latency? P50 = 120ms, P99 = 450ms
- What's the error rate? 0.3%
These are system behavior metrics.
Agent monitoring needs to answer some fundamentally different questions:
- Is the response accurate? (Factual Correctness)
- Is the response relevant? (Topic Relevancy)
- Is the reasoning sound? (Reasoning Quality)
- Was the tool selection appropriate? (Decision Quality)
- Are there hallucinations? (Hallucination Detection)
Datadog's LLM Observability includes built-in quality checks[11]: Failure to Answer, Topic Relevancy, Toxicity, Negative Sentiment. Traditional APM tools don't care about any of this.
We're shifting from observing "system behavior" to observing "semantic quality."
This means we can't just record what was called—we need to understand why it was called and how good the result was. That requires deep visibility into call internals and preserving complete context.
Feedback Loops: Observability Drives Agent Evolution
Traditional observability is reactive: something breaks, an alert fires, engineers start debugging.
Agent observability needs proactive feedback loops:
Prompt Design → Deploy → Observe Effects → Analyze Patterns → Optimize Prompt → Redeploy → ...How fast this loop runs determines how fast your agents improve.
Honeycomb CEO Charity Majors puts it this way[12]:
Observability 2.0 is very much about how you develop your code... when you have an observability 2.0 mindset and toolkit, you can see where that time is going.
This matters even more for agents. Agent behavior is non-deterministic—the same input can produce different outputs. Shrinking feedback cycles from days to minutes dramatically accelerates iteration.
Observability is no longer just an ops tool—it's core infrastructure for agent intelligence evolution.
New Plays (Part 2): Multi-Agent Makes Everything Harder
Single-agent observability is already complex. When multiple agents collaborate, problems scale exponentially.
The Observability Trilemma
Galileo proposed an "Observability Trilemma" in their blog[13]:
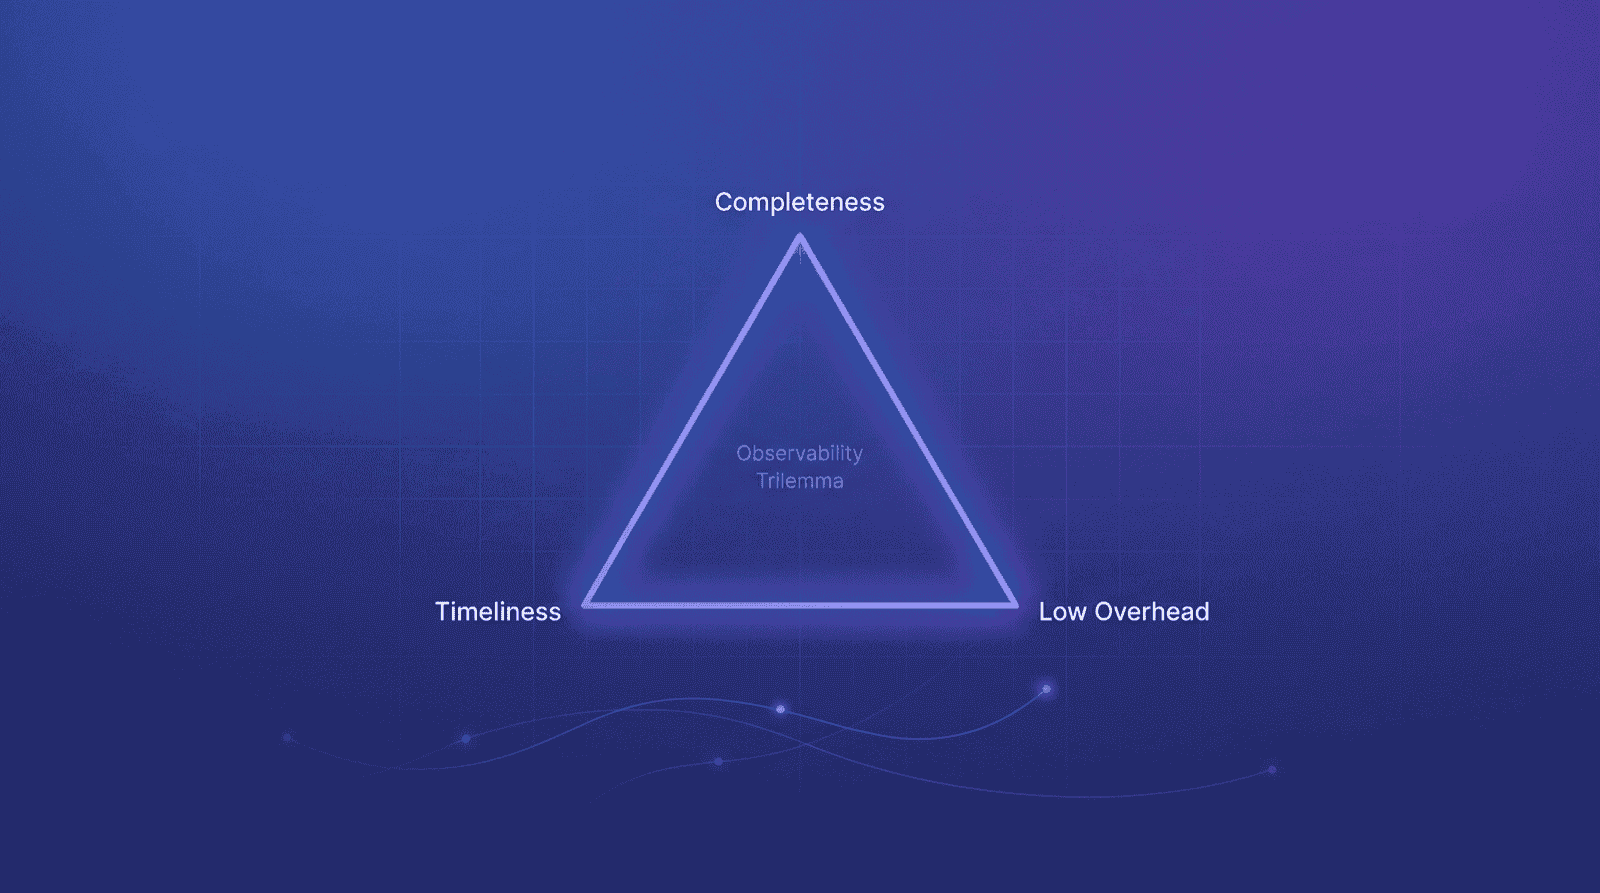
- Completeness: Capture all behaviors from all agents
- Timeliness: See data in real-time for fast feedback
- Low Overhead: Minimal impact on agent performance
This presents what we call the "observability trilemma"—you can have completeness (capturing all data), timeliness (seeing it when needed), or low overhead (not disrupting your system)—but rarely all three simultaneously.
This trilemma isn't absolute, but it captures the trade-offs teams face in practice. In single-agent scenarios, you can manage through trade-offs. In multi-agent collaboration:
- Each agent has its own memory state to track
- Inter-agent communication, handoffs, and task delegation need correlation
- Emergent behaviors are hard to detect with predefined metrics
The complexity compounds quickly.
The State Black Hole
Agent decisions depend on internal state:
- Short-term Memory: Current conversation context
- Long-term Memory: Persisted knowledge and preferences
- Framework State: LangGraph's state, CrewAI's memory
Here's the problem: these states are often opaque.
Traditional trace views look like a black box:
Input → [Black Box] → OutputUnderstanding agent behavior requires seeing this:
Input
  → Planning (reasoning process)
  → State Query (memory lookup)
  → Tool Selection (why this tool?)
  → Tool Execution (results)
  → State Update (state changes)
  → Response Generation
  → Output
We need to go deep into each step. Every step's state should be observable, because each one affects the agent's final output.
Datadog emphasizes this[6:1]:
This includes visibility into agent memory states such as CrewAI's short-term and long-term memory or LangGraph's state, which can be crucial for understanding decision-making processes.
Agent memory and state must become first-class citizens. Without observing state, you can't understand decisions. Without understanding decisions, you can't optimize agents. This is a significant departure from traditional APM.
Distributed Tracing Fragmentation
Take MCP (Model Context Protocol) as an example. A typical call chain:
User → Agent (Client) → LLM Provider → MCP Server → External Tool
         |                                |
         Trace A                          Trace B (disconnected!)
Glama's technical blog discusses this in detail[14]:
The primary architectural challenge lies in unifying these two paths into a single distributed trace... To achieve true end-to-end tracing, the client must propagate the Trace ID into the request sent to the MCP server.
Current challenges:
- How do you correlate client-side and server-side traces?
- W3C Trace Context standards need to propagate across all components
- No community consensus on semantic conventions yet (e.g.,
mcp.tool_name,agent.session_id)
OpenTelemetry is developing Agent Framework Semantic Conventions[15], defining concepts like Tasks, Actions, Agents, Teams, Artifacts, and Memory. But widespread adoption is still a ways off.
The core challenge of multi-agent observability is cross-boundary context propagation. This isn't just a technical problem—it's a standardization problem. And frankly, this wasn't fully solved in the microservices era either.
A Deeper Insight: This Is Really About Wide Events
Let's step back and review what we've identified:
- Semi-structured, high-dimensional, context-rich data
- Post-hoc semantic quality analysis instead of just pre-aggregated metrics
- Raw data preservation to support fast feedback loops
- Unified storage to eliminate silos and correlate metrics/logs/traces
Sound familiar?
This is exactly what Charity Majors' Observability 2.0 and Wide Events address.
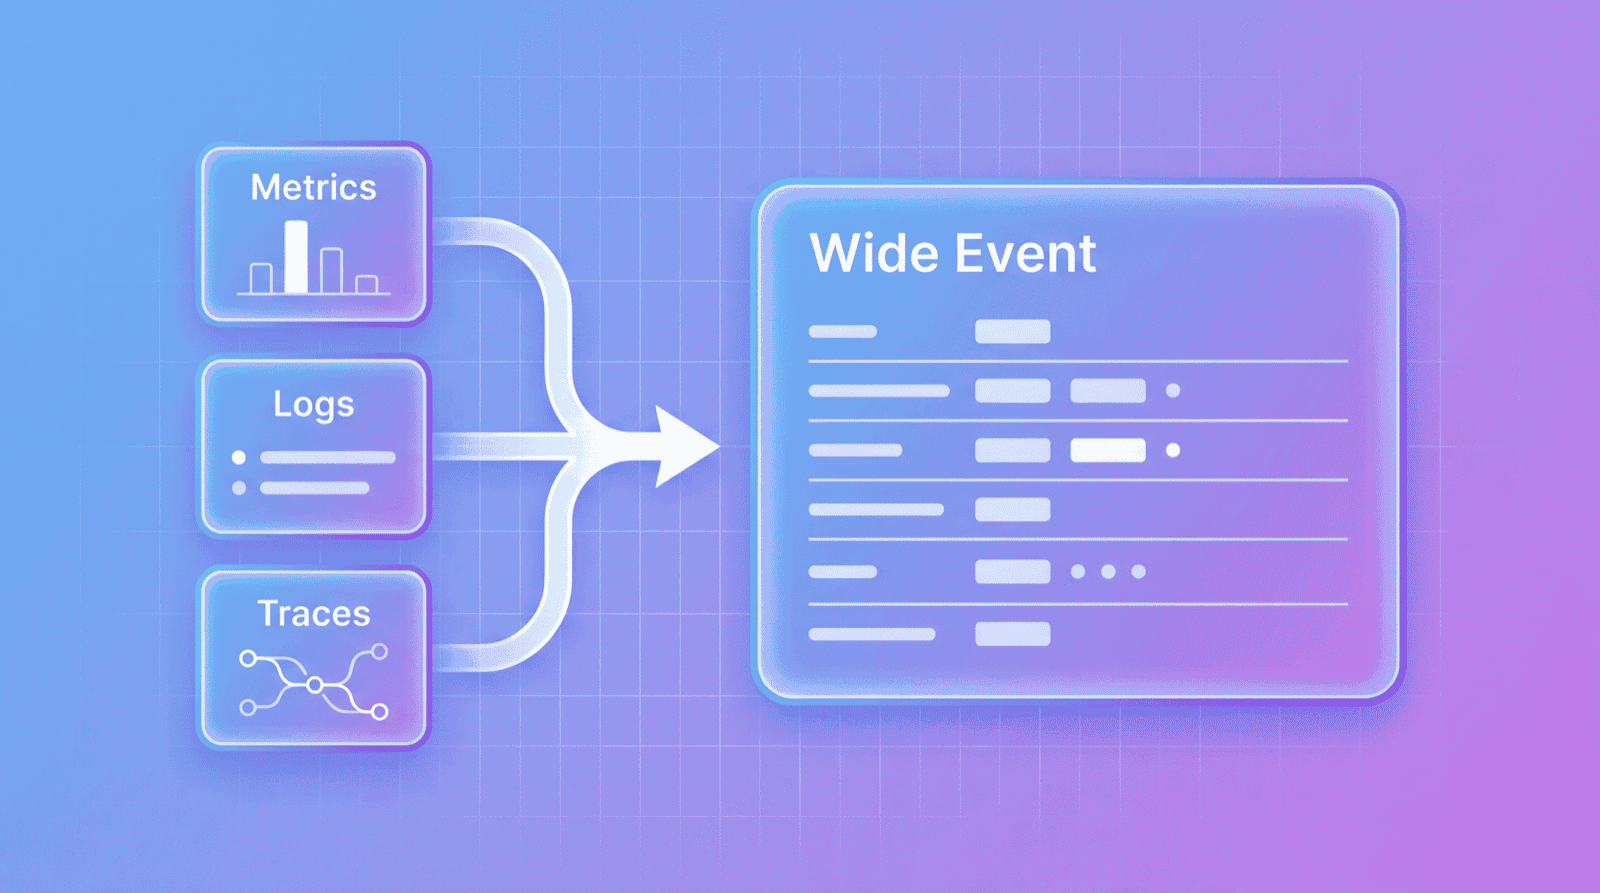
What Are Wide Events?
Wide Events is a data model pioneered by Honeycomb. The core idea: replace scattered metrics/logs/traces with a single, wide-format structured event as the single source of truth for observability.
Charity Majors formally introduced Observability 2.0 in late 2024[16]:
Let's call the metrics, logs and traces crowd—the "three pillars" generation of tooling—that's "Observability 1.0". Tools like Honeycomb, which are built based on arbitrarily-wide structured log events, a single source of truth—that's "Observability 2.0".
Wide Events have these core characteristics:
- High Cardinality: Can include unique identifiers like
user_idandtrace_id - High Dimensional: A single event can have dozens or hundreds of fields
- Context-rich: Preserves complete request context
- Single Source of Truth: Derive metrics/logs/traces from raw events instead of storing them separately
If you're new to the concept, check out Observability Wide Events 101 for a solid introduction.
Agent Data Is Naturally Wide Events
Consider a typical agent execution event:
json
{
  "timestamp": "2025-01-15T10:30:45.123Z",
  "trace_id": "abc123",
  "session_id": "user-session-456",
  "agent_name": "research-assistant",

  "model": "claude-sonnet-4-20250514",
  "input_tokens": 1523,
  "output_tokens": 892,
  "latency_ms": 2340,

  "prompt": "Based on the user's question about...",
  "response": "Here are my findings...",

  "tool_calls": [
    {"name": "web_search", "params": {"query": "..."}, "duration_ms": 450}
  ],

  "reasoning": "User asked about X, decided to search because...",
  "memory_state": {"short_term": [...], "long_term_refs": [...]},

  "quality_score": 0.85,
  "topic_relevancy": 0.92
}
This is a classic Wide Event: high cardinality (trace_id, session_id), high dimensional (dozens of fields), context-rich (preserving prompt, response, reasoning).
Why O11y 1.0 Struggles with Agent Data
Using the traditional three-pillars approach:
| Approach | Problem |
|---|---|
| Stuff prompt/response into logs | Loses structure, hard to analyze |
| Stuff tool calls into traces | Schema too rigid for dynamic structures |
| Pre-aggregate token usage into metrics | Loses context—can't trace back which prompt caused high latency |
| Store separately and correlate | Data silos, cross-system queries are painful |
We've seen teams debug a hallucination issue using traditional tools—pulling data from 3 different systems, manually correlating trace IDs, spending hours to locate the problematic prompt. With Wide Events, the same analysis takes a single query.
Charity Majors nails it[17]:
The cost of the time engineers spend laboring below the value line—trying to understand their code, their telemetry, their user behaviors—is astronomical. Poor observability is the dark matter of engineering teams.
Agent Scenarios Make Wide Events Essential
| Agent Observability Need | How Wide Events Help |
|---|---|
| Semi-structured data storage | Native support for high dimensions and dynamic schemas |
| Semantic quality analysis | Derive arbitrary metrics post-hoc from raw data |
| Fast feedback loops | Define new analysis dimensions without modifying instrumentation |
| State tracking | Single source of truth preserves full context |
| Unified correlation | Three pillars become views of the same data |
For traditional applications, Wide Events are a better choice. For agents, they're practically mandatory.
Agent observability isn't an entirely new field—it's the best-practice scenario for Observability 2.0.
Infrastructure Requirements: What the Storage Layer Needs
Understanding the Wide Events philosophy, the next question is: how do you implement it?
Core Requirements
- Unified Storage — One system for metrics, logs, traces, and semi-structured data, eliminating data silos
- Cloud-Native Architecture — Object storage + decoupled compute and storage for cost control and elastic scaling
- Real-Time Processing — Low-latency ingestion and queries for dashboards and alerting
- Derivation Capabilities — Real-time metric derivation from raw events without preprocessing
- Flexible Querying — Support both routine queries (dashboards) and exploratory queries (ad-hoc analysis)
- Open Standards — OTel protocol compatibility to avoid vendor lock-in
The key insight: shift complexity from the agent to the storage layer. Agents send raw events; the storage layer handles processing, aggregation, and indexing.
Addressing the Observability Trilemma
| Challenge | Solution Approach |
|---|---|
| Completeness | Unified storage eliminates silos; native semi-structured data support |
| Timeliness | Stream processing derives metrics in real-time; decoupled compute/storage enables elastic queries |
| Low Overhead | Low overhead for raw data writes; aggregation happens asynchronously in the storage layer |
Industry Trends
Wide Events and Agent Observability are becoming a battleground for database vendors.
ClickHouse launched ClickStack in 2025[18], explicitly adopting Wide Events as its core data model. They also acquired HyperDX to complete their UI layer and released a dedicated LLM Observability solution[19] supporting OpenAI Agents, LangChain, and other frameworks. Companies like Laminar are already using ClickHouse for AI Browser Agent observability, processing over 500,000 browser session events daily[8:1].
GreptimeDB, as a unified observability database, proposes the concept of "three pillars become views"[20]—Metrics, Logs, and Traces aren't separate storage systems but different query views of the same underlying data. Its built-in Pipeline (preprocessing engine) handles structured parsing and field extraction at write time; the Flow Engine (stream processing) derives aggregated metrics from raw events in real-time without preprocessing pipelines. This architecture naturally fits agent scenarios: write high-dimensional raw events, derive metrics and traces on demand.
What does this trend tell us? Wide Events are no longer theoretical—they're becoming the practical architecture choice for next-generation observability storage. Whether OLAP databases (like ClickHouse) or unified observability databases (like GreptimeDB), all are moving toward unified storage and raw-data-first approaches.
For agent observability, this is good news: the underlying infrastructure is maturing.
Conclusion
The old playbook still works. The Metrics, Logs, Traces framework and OpenTelemetry standards remain applicable to agent scenarios.
But it needs new plays. Agents bring fundamental changes in data shape (semi-structured, high-dimensional), observation targets (from system behavior to semantic quality), and usage patterns (fast feedback loops driving evolution).
The deeper insight: these new plays are essentially Wide Events. Agent observability isn't an entirely new field—it's the scenario where Observability 2.0's value becomes most apparent. For traditional applications, Wide Events are a better choice. For agents, they're practically mandatory.
Key infrastructure requirements: unified storage, raw data first, elastic scaling, real-time processing.
Next steps:
- Follow the OpenTelemetry GenAI SIG for updates
- Try agent tracing capabilities in Langfuse, ClickStack, or GreptimeDB
- Join the Agent Framework Semantic Conventions discussion
Standardization is underway. Now is the time to participate and shape this field.
References
Linux Foundation Announces the Formation of the Agentic AI Foundation ↩︎
Datadog Expands LLM Observability with New Capabilities to Monitor Agentic AI ↩︎
Semantic Conventions for Generative AI Systems | OpenTelemetry ↩︎
Building Unified Observability Storage with Rust | Greptime ↩︎
Monitor, troubleshoot, and improve AI agents with Datadog ↩︎ ↩︎
Langfuse and ClickHouse: A new data stack for modern LLM applications ↩︎
How Laminar is using ClickHouse to reimagine observability for AI browser agents ↩︎ ↩︎
Scaling our Observability platform beyond 100 Petabytes by embracing wide events | ClickHouse ↩︎
Live Your Best Life With Structured Events | Charity Majors ↩︎
Monitor, troubleshoot, improve, and secure your LLM applications with Datadog LLM Observability ↩︎
Observability: the present and future, with Charity Majors | The Pragmatic Engineer ↩︎
9 Key Challenges in Monitoring Multi-Agent Systems at Scale | Galileo ↩︎
OpenTelemetry for Model Context Protocol (MCP) Analytics and Agent Observability | Glama ↩︎
Semantic Conventions for Generative AI Agentic Systems | OpenTelemetry GitHub ↩︎
It's Time to Version Observability: Introducing Observability 2.0 | Honeycomb ↩︎
There Is Only One Key Difference Between Observability 1.0 and 2.0 | Honeycomb ↩︎
ClickStack: High-Performance Open-Source Observability | ClickHouse ↩︎
Observability Data Lake is more than Data Lake itself | Greptime ↩︎


