How to Send Metrics and Logs to GreptimeDB with Vector
Introduction
Vector is a vendor-neutral pipeline for collecting, transforming, and routing observability data. It sits between your sources (hosts, containers, Kafka, OpenTelemetry, StatsD) and whatever storage you point it at, and it does the buffering, batching, and reshaping that every production ingest path eventually needs.
GreptimeDB is a native Vector sink for both signals. Vector ships two GreptimeDB components out of the box: greptimedb_metrics and greptimedb_logs. That matters because most pipeline backends only take one signal. You send metrics to one system and logs to another, then run two ingest paths with two sets of failure modes. With GreptimeDB, the same Vector agent writes metrics and logs into one database, where SQL queries both signals and PromQL runs over the metrics.
This guide covers the practical end of that integration: which sink to use for which signal, how Vector data lands in GreptimeDB tables, where to put transforms, and the knobs that keep the pipeline healthy under load. Configs are taken from the official Vector integration docs and are based on Vector v0.49.0.
The Two Native Sinks
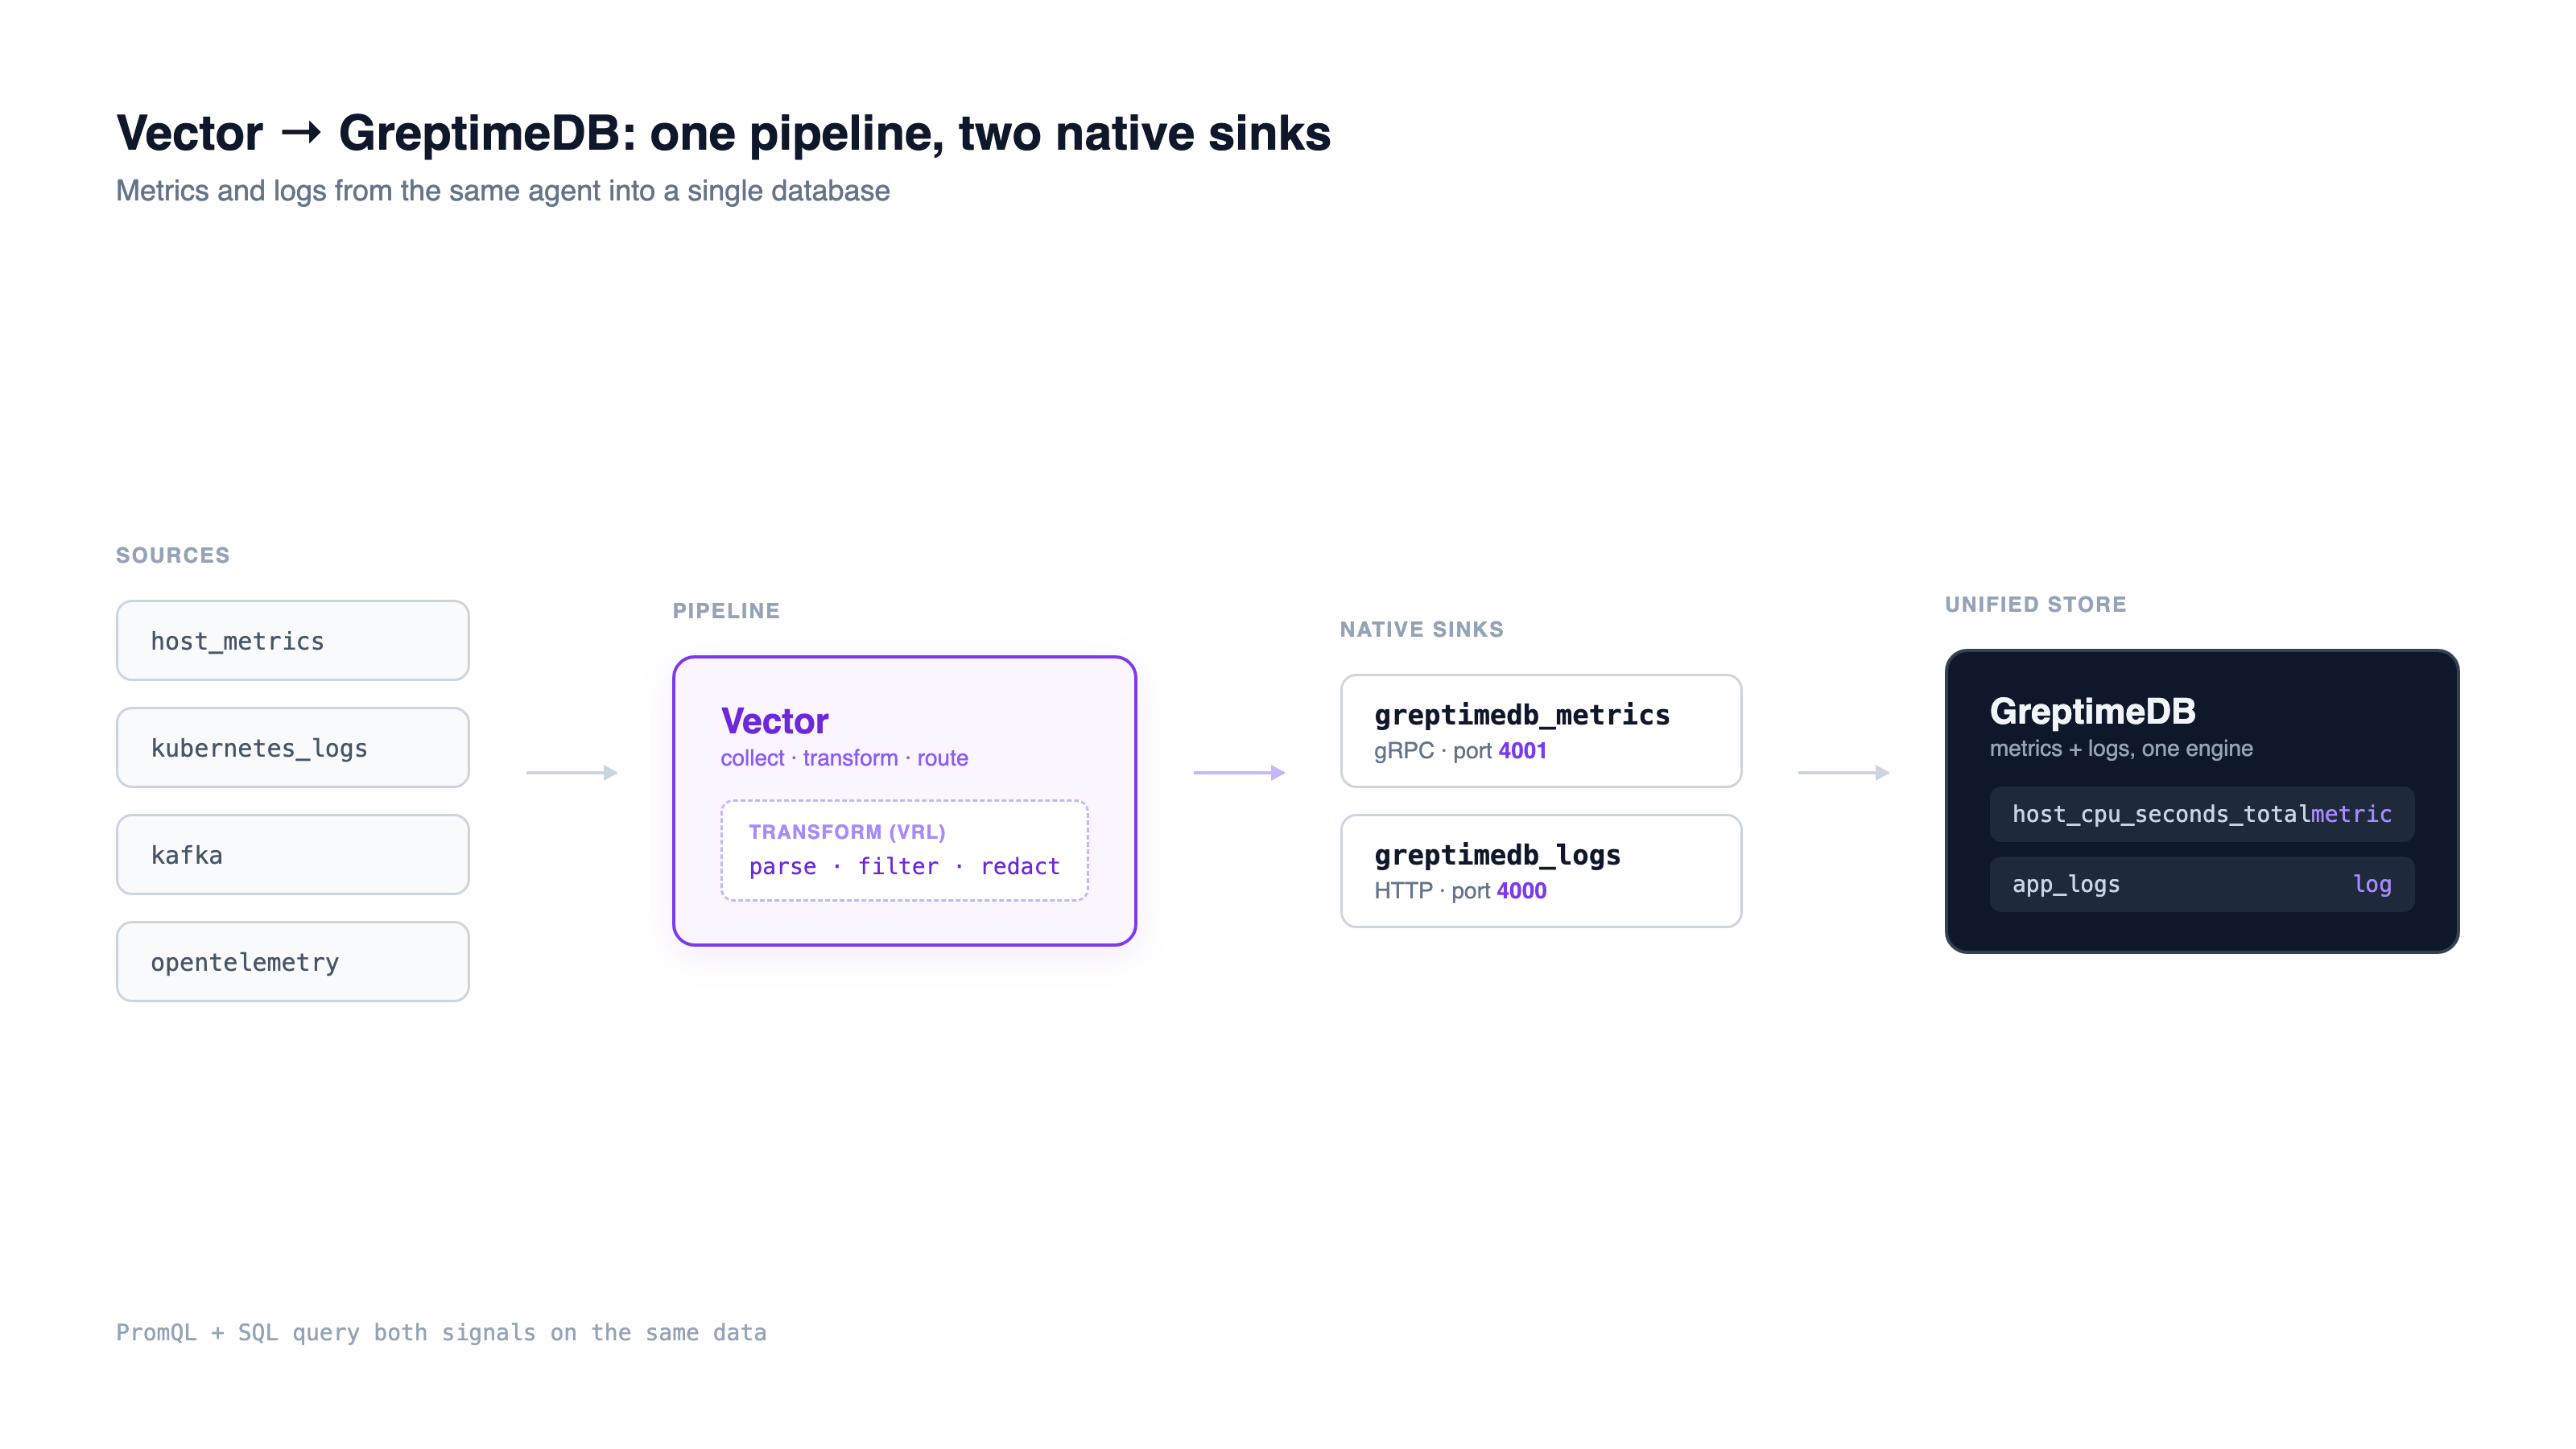
GreptimeDB exposes a different protocol for each signal, so the two sinks point at different ports.
greptimedb_metrics talks gRPC, defaulting to port 4001:
[sources.in]
type = "host_metrics"

[sinks.my_sink_id]
inputs = ["in"]
type = "greptimedb_metrics"
endpoint = "<host>:4001"
dbname = "<dbname>"
username = "<username>"
password = "<password>"
new_naming = true
greptimedb_logs talks HTTP, defaulting to port 4000:
[sources.my_source_id]
type = "demo_logs"
count = 10
format = "apache_common"
interval = 1

[sinks.my_sink_id]
type = "greptimedb_logs"
inputs = ["my_source_id"]
compression = "gzip"
dbname = "public"
endpoint = "http://<host>:4000"
pipeline_name = "greptime_identity"
table = "<table>"
username = "<username>"
password = "<password>"
Two sinks, two ports, one database. Both take a username and password for authentication. If you changed the default gRPC port when starting GreptimeDB, point the metrics sink at your port instead. For the full set of sink options, see the greptimedb_metrics and greptimedb_logs references on vector.dev.
How Vector Metrics Map to Tables
The greptimedb_metrics sink does not need a schema up front. Each Vector metric becomes a GreptimeDB table named <metric namespace>_<metric name>, for example host_cpu_seconds_total. The metric timestamp becomes the time index in a column called ts, and the metric's tags become GreptimeDB tags.
The value side depends on the Vector metric type, and this is where the mapping is more than a passthrough:
| Vector metric type | How values are stored |
|---|---|
| Counter, Gauge | value in the val column |
| Set | data-point count in the val column |
| Distribution | each percentile in a pxx column, plus min / max / avg / sum / count |
| AggregatedHistogram | each bucket in a bxx column (xx = upper bound), plus sum / count |
| AggregatedSummary | each percentile in a pxx column, plus sum / count |
| Sketch | each percentile in a pxx column, plus min / max / avg / sum |
An AggregatedHistogram keeps each bucket as its own bxx column, where xx is the bucket's upper bound, next to sum and count. You query those columns directly in SQL, or run histogram_quantile() over them in PromQL. The point is that aggregated types keep their structure as real columns instead of being flattened into opaque blobs, which is what makes them queryable after the fact.
If you prefer to keep an existing pipeline, the same sink config block accepts influxdb_metrics (InfluxDB line protocol) or prometheus_remote_write instead, both pointed at GreptimeDB's HTTP port 4000. Use those when you already emit one of those formats; use greptimedb_metrics when you want native auth and the naming scheme above.
Logs and the Pipeline Engine
The greptimedb_logs sink hands each event to GreptimeDB's Pipeline engine, named by the pipeline_name field. The built-in greptime_identity pipeline does the obvious thing: it creates a column for every JSON field, infers the type, flattens nested objects with dot notation, and creates the target table on first write. No CREATE TABLE, no schema migration.
A batch of JSON logs sent through greptime_identity produces a table like this:
greptime_timestamp | TimestampNanosecond | PRI | TIMESTAMP
level              | String              |     | FIELD
message            | String              |     | FIELD
service            | String              |     | FIELD
user_id            | Int64               |     | FIELD
If no time index is present in the data, the pipeline adds greptime_timestamp and uses it as the time index. When you need more than identity mapping (dissecting an unstructured line into fields, parsing dates, marking a column for full-text indexing), you upload a custom pipeline and reference it by name in pipeline_name. Pipelines are versioned, so you can change parsing rules without breaking in-flight writes. The Kafka-to-GreptimeDB walkthrough shows a custom pipeline with dissect and date processors plus index configuration end to end.
For logs that arrive as Loki push requests, GreptimeDB also speaks the Loki protocol, so a Vector loki sink works too. The tradeoff: Vector's Loki sink can't set custom headers, so it can't select a pipeline. When you want pipeline processing, stay on greptimedb_logs.
Shaping Data Before It Lands
Most of the value in a Vector pipeline is in the middle, in the transform stage. Vector Remap Language (VRL) is an expression language for rewriting events before they reach the sink: parse a field, drop the noise, redact a secret, add a tag.
[transforms.parse]
inputs = ["my_source_id"]
type = "remap"
source = '''
  . = parse_apache_log!(.message, format: "common")
  if .status >= 400 { .level = "error" }
'''
Doing this at the edge keeps the database doing storage and query work instead of parsing, and it means the schema GreptimeDB auto-creates reflects fields you actually want rather than a raw message blob. The fallible form (parse_apache_log! with the !) aborts the event on a parse error, which you then route or drop explicitly rather than silently corrupting a column. The VRL deep dive walks through parsing, filtering, replacement, and error handling with full configs.
Keeping the Pipeline Healthy at Scale
A pipeline that works on a laptop can fall over under a traffic spike. Vector has three controls that matter once volume grows, and all of them sit on the sink.
Buffers decide what happens when the sink can't keep up. The default in-memory buffer holds a bounded number of events and blocks the source when full; switching to a disk buffer trades latency for durability across restarts. Rate limits and batching cap how hard Vector pushes the database. For the logs sink, the ceiling is batch.max_events * request.rate_limit_num / request.rate_limit_duration_secs events per unit time:
[sinks.my_sink_id]
type = "greptimedb_logs"
# ... endpoint, auth ...
batch.max_events = 1000
request.rate_limit_num = 1
request.rate_limit_duration_secs = 1
The buffer and rate-limit guide covers when to reach for each. Adaptive Request Concurrency goes a step further and lets Vector discover the right concurrency from observed latency instead of a fixed number, which is the safer default when downstream capacity varies; the ARC writeup explains the feedback loop. Together these turn a best-effort forwarder into a pipeline that protects the database during incidents instead of amplifying them.
One Backend for Metrics and Logs
Because both sinks read from the same Vector topology, a single agent can fan one source out to several destinations, or carry metrics and logs in parallel into the same GreptimeDB instance:
[sinks.metrics]
type = "greptimedb_metrics"
inputs = ["host_metrics_source"]
endpoint = "greptimedb:4001"

[sinks.logs]
type = "greptimedb_logs"
inputs = ["log_source"]
endpoint = "http://greptimedb:4000"
pipeline_name = "greptime_identity"
table = "app_logs"
That is the structural difference from a metrics-only backend. When logs live in one system (often Loki) and metrics in another, every correlation across the two is a cross-system join done by hand or by a dashboard tool. GreptimeDB stores metrics and logs in one engine, built in Rust with object storage as the primary tier, so the same query reaches both. Vector is the collection layer; GreptimeDB is the unified store underneath it. For the Kubernetes case specifically, the Vector on Kubernetes guide collects pod logs, node metrics, and cluster events through one DaemonSet.
Conclusion
Pointing Vector at GreptimeDB is two sink blocks: greptimedb_metrics over gRPC for metrics, greptimedb_logs over HTTP for logs, both with username/password auth and automatic table creation. The work that decides whether the pipeline survives production is upstream of the sink: VRL transforms to shape data, and buffers, rate limits, and adaptive concurrency to handle load. Get those right and you have one collection agent feeding one database that answers SQL over both signals and PromQL over the metrics.
For the deeper operational topics, the Vector in production post covers deployment topologies and health checks.
About Greptime
GreptimeDB is an open-source, cloud-native database purpose-built for real-time observability. Built in Rust and optimized for cloud-native environments, it provides unified storage and processing for metrics, logs, and traces, delivering sub-second insights from edge to cloud at any scale.
- GreptimeDB OSS: the open-source database for observability and IoT workloads, with compute-storage disaggregation and object storage as the primary tier.
- GreptimeDB Enterprise: adds operational features for production scale, including 5× bulk ingestion, auto-repartition, read replicas, LDAP/RBAC, management console, and 24/7 expert support.
Stay in the loop
Join our community
Get the latest updates and discuss with other users.


