On this page
Previously, users could use the Prometheus data source plugin to connect to GreptimeDB for PromQL queries.
GreptimeDB achieves more than 80% PromQL compliance and thus can be connected via the Prometheus plugin. However, since GreptimeDB utilizes a multi-value model rather than Prometheus' single-value model, and GreptimeDB supports various advanced features, using the Grafana Prometheus data source plugin for GreptimeDB connection cannot unleash its full potential.
Therefore, we developed the Grafana GreptimeDB data source plugin based on the Prometheus data source plugin. This plugin natively supports all features of GreptimeDB, such as the multi-value model and SQL queries. Additionally, compared to directly using the Prometheus data source, it also addresses compatibility issues.
Building on the Prometheus Data Source Plugin
We modified the Grafana Prometheus built-in data source plugin, which is integrated into Grafana and cannot run independently as a standard plugin.
To make the GreptimeDB plugin run as a standard plugin, we made the following changes:
- Addressed front-end dependency issues: resolved dependency path changes using Webpack alias and refined some code to reduce unnecessary dependencies.
- Implemented the backend Go functions (the plugin itself does not contain related Go code).
Installing the Plugin
You can install the GreptimeDB data source plugin using one of the following methods.
The first approach is to download the latest version and extract the files to your Grafana plugin directory.
A download URL example can be: https://github.com/GreptimeTeam/greptimedb-grafana-datasource/releases/tag/v1.0.37.
The other approach is to use the Grafana CLI tool to download and install:
shell
grafana cli --pluginUrl https://github.com/GreptimeTeam/greptimedb-grafana-datasource/releases/latest/download/info8fcc-greptimedb-datasource.zip plugins install info8fccConfiguring the Connection
- Enter the GreptimeDB server URL, e.g.,
http://<host>:4000. - Enter the database name, default as
public. - If authentication is required, select basic auth and enter the GreptimeDB username and password.
- Click the
Save & Testbutton to test the connection.
Setting Up Node Exporter Dashboard with Local GreptimeDB
In the GreptimeDB data source plugin repository, we provide a ready-to-use Docker Compose configuration file that can start GreptimeDB, Prometheus, Prometheus Node Exporter, Grafana, and this plugin with one command.
Clone the repository and run Docker Compose to start the services:
bash
git clone https://github.com/GreptimeTeam/greptimedb-grafana-datasource.git
cd greptimedb-grafana-datasource/docker
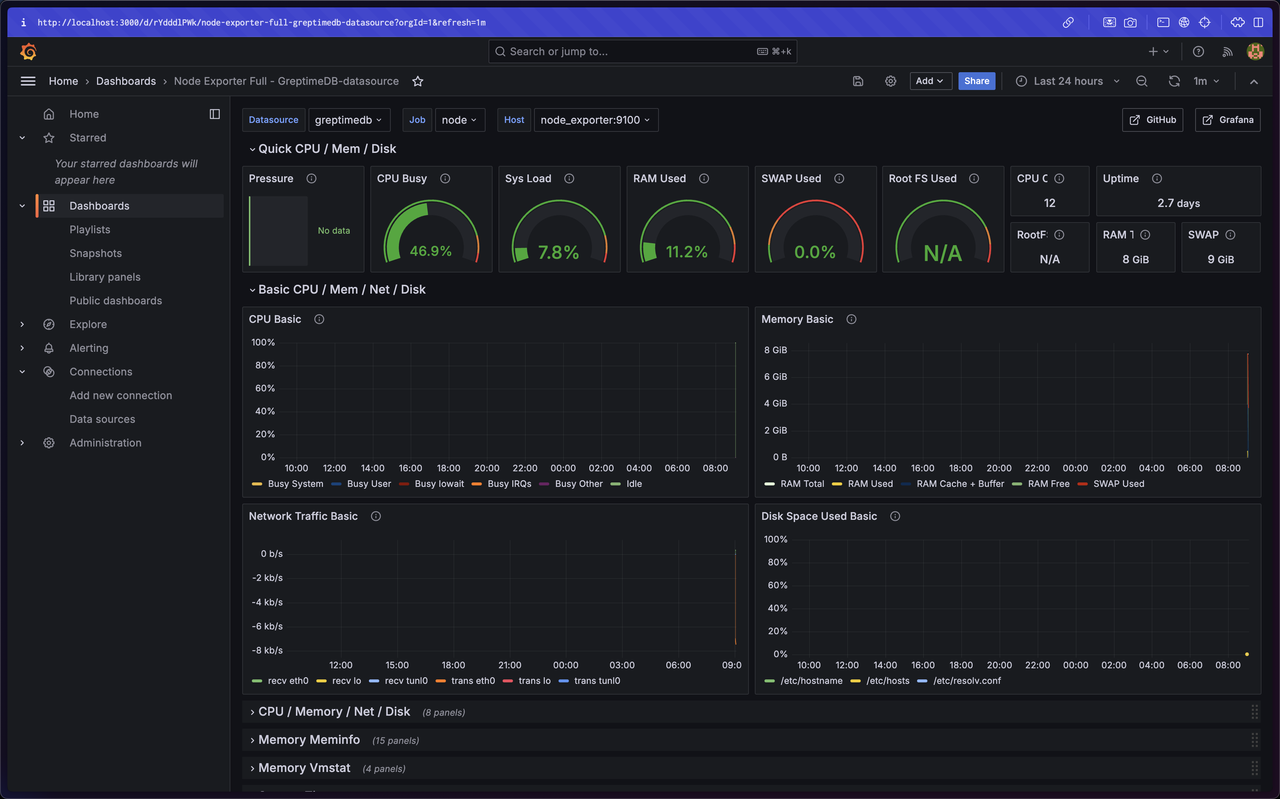
docker compose upUsing the above configuration, you can directly run and view the results with the built-in GreptimeDB Data Source Connection and Node Exporter Dashboard.
- Enter
http://localhost:3000to open the Grafana interface. - The default username and password are both
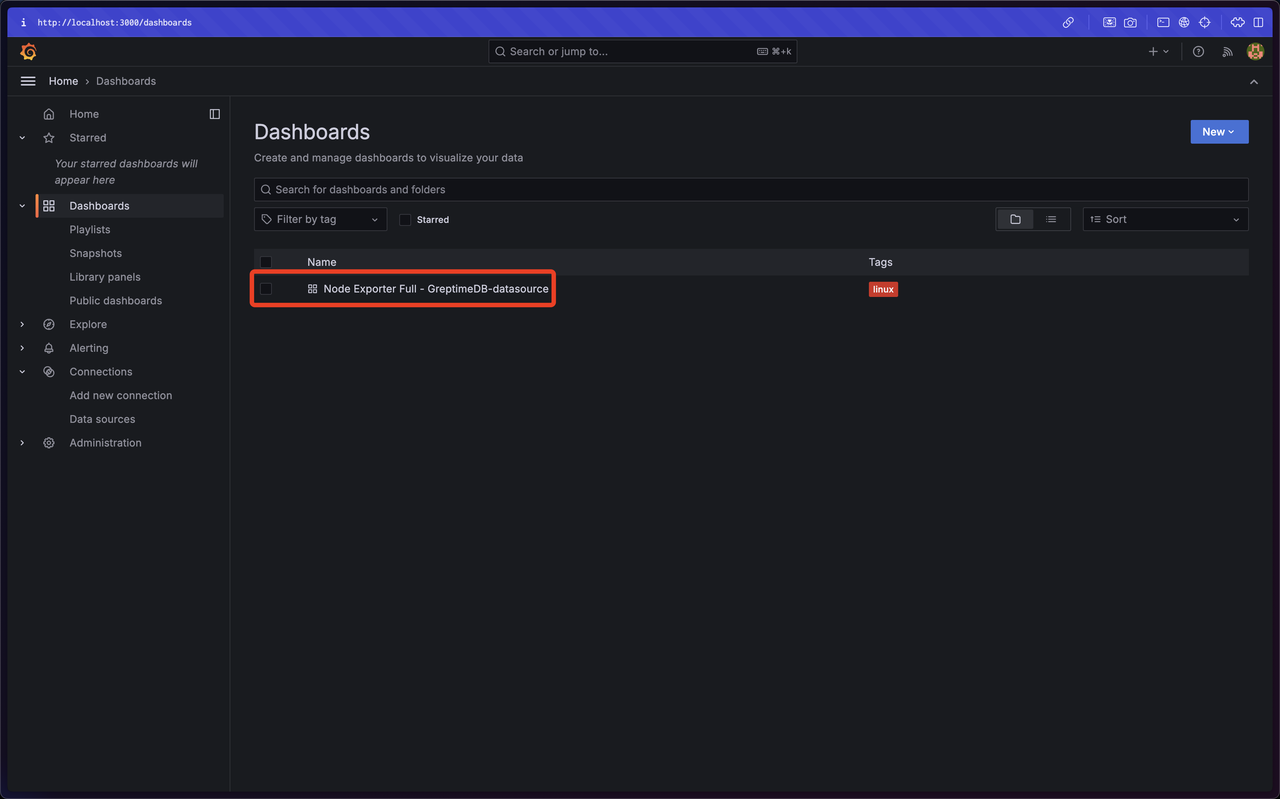
admin. - On the Dashboards page, you can see the Node Exporter Full dashboard.
TIP
If the dashboard does not display Node Exporter Full, ensure that the Starred filter is not selected.
Users need to pay attention to the following two key configurations.
- Configure Prometheus Remote-Write to Upload Data to GreptimeDB:
yaml
remote_write:
- url: http://greptimedb:4000/v1/prometheus/write?db=public- Grafana Configuration:
yaml
grafana:
    image: grafana/grafana:latest
    container_name: grafana_info8fcc
    ports:
      - 3000:3000
    environment:
     - GF_INSTALL_PLUGINS=https://github.com/GreptimeTeam/greptimedb-grafana-datasource/releases/latest/download/info8fcc-greptimedb-datasource.zip;info8fcc // 安装插件
    volumes:
      - ../provisioning:/etc/grafana/provisioning // 使用预制 provision
    networks:
      - datasource-network
Connecting to GreptimeCloud with the GreptimeDB Data Source Plugin
After installing the Prometheus client and Node Exporter client, data can be uploaded to GreptimeCloud. Users need to pay attention to the following two key configurations:
- Configure Prometheus Remote Write/Read
yaml
remote_write:
  - url: https://t3yzenagas4a.us-west-2.aws.greptime.cloud/v1/prometheus/write?db=lpw7na1gmw4gcool_debt-public
    basic_auth:
      username: NXOZb0pywez9y5LpGNFXvSAM
      password: ********

remote_read:
  - url: https://t3yzenagas4a.us-west-2.aws.greptime.cloud/v1/prometheus/read?db=lpw7na1gmw4gcool_debt-public
    basic_auth:
      username: NXOZb0pywez9y5LpGNFXvSAM
password: ********- Configure GreptimeDB Data Source Plugin Connection
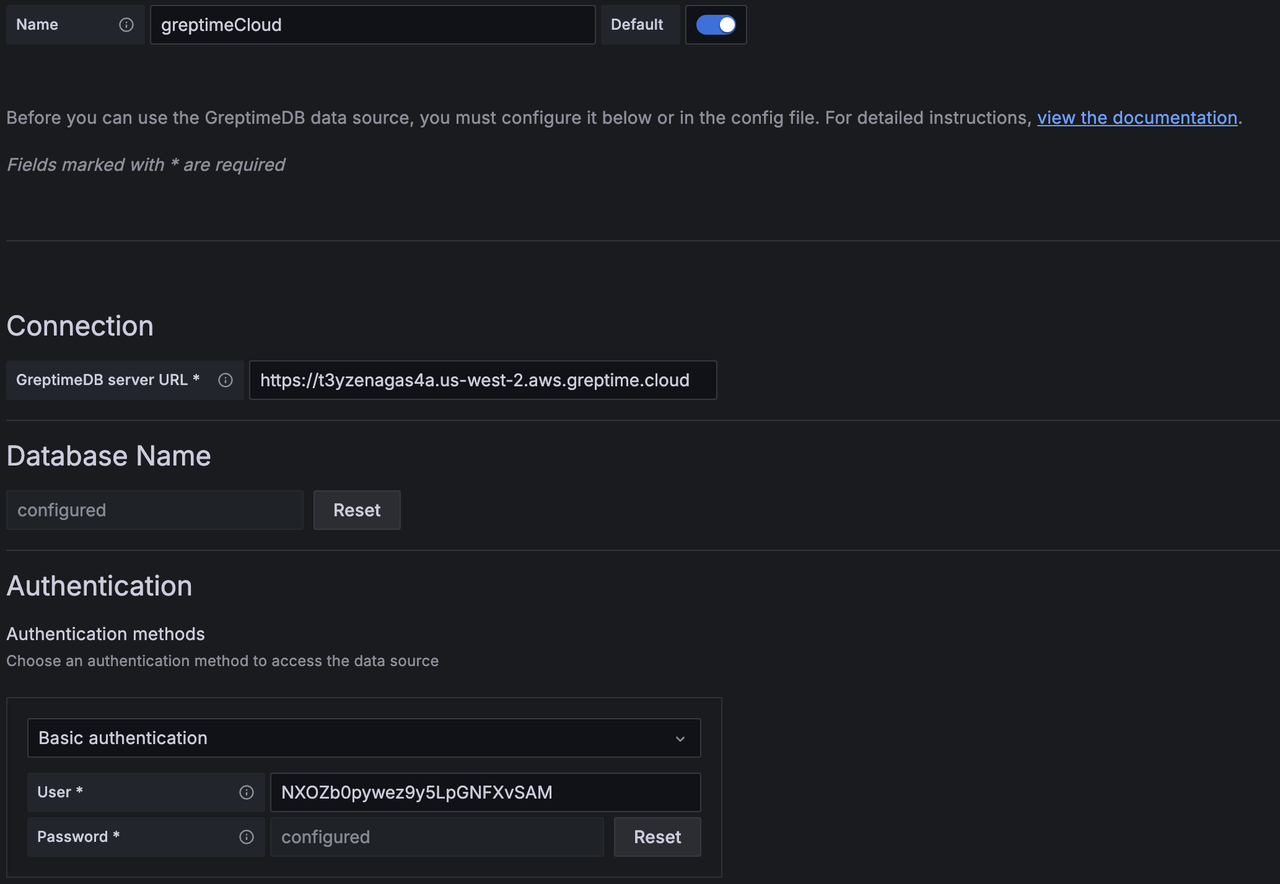
TIP
Please ensure that the Host corresponds to the GreptimeDB server URL and should includes the https:// prefix.
Log in to GreptimeCloud, click Connection Information to get the configuration details.
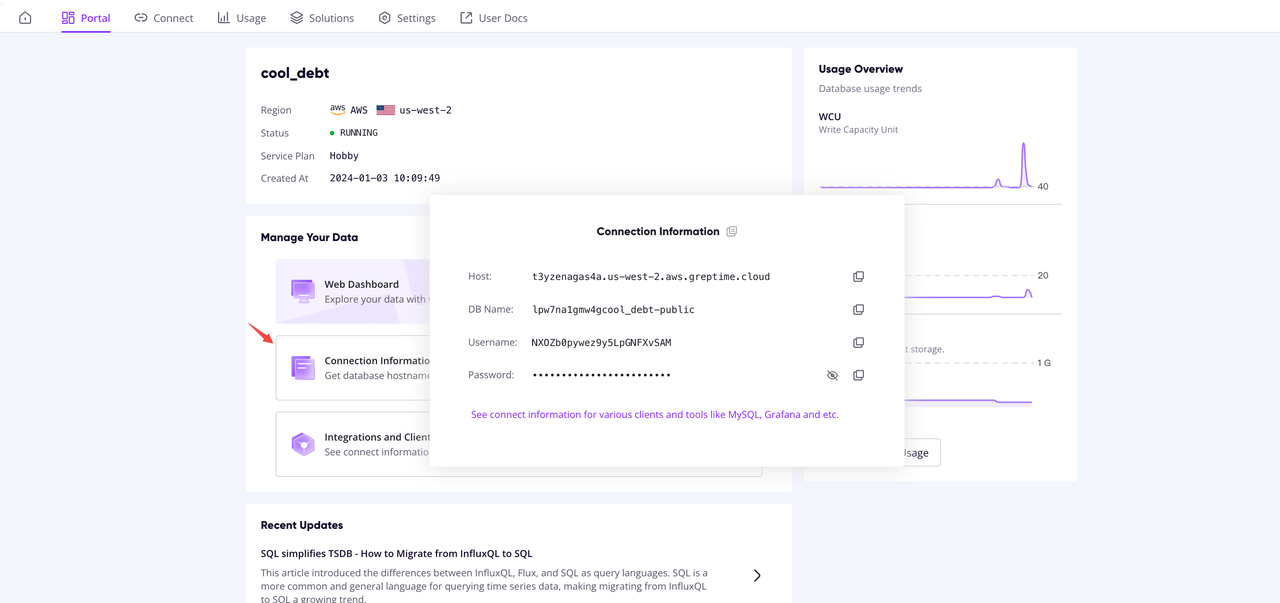
Now you can query data on GreptimeCloud using the GreptimeDB data source plugin.
About Greptime
Greptime offers industry-leading time series database products and solutions to empower IoT and Observability scenarios, enabling enterprises to uncover valuable insights from their data with less time, complexity, and cost.
GreptimeDB is an open-source, high-performance time-series database offering unified storage and analysis for metrics, logs, and events. Try it out instantly with GreptimeCloud, a fully-managed DBaaS solution—no deployment needed!
The Edge-Cloud Integrated Solution combines multimodal edge databases with cloud-based GreptimeDB to optimize IoT edge scenarios, cutting costs while boosting data performance.
Star us on GitHub or join GreptimeDB Community on Slack to get connected.


