GreptimeDB as an Alternative to InfluxDB for Time-Series Data
Introduction
InfluxDB has dominated the time-series space for nearly a decade, yet modern observability workloads now demand far more than metric storage alone. Teams need a cloud-native, unified observability platform that can scale from edge gateways to multi-region Kubernetes clusters while remaining cost-effective. InfluxDB's own trajectory reflects this pressure — the storage engine, query language, and licensing changed across v1, v2, and v3, leaving adopters to choose which version to bet on. GreptimeDB—an open-source, Rust-based high-performance database—has emerged as the best "alternative to InfluxDB for time-series data", offering real-time analytics for metrics, logs, and traces across heterogeneous environments. GreptimeDB reached v1.0 GA in April 2026, marking the transition from a fast-moving project to long-term maintained infrastructure.
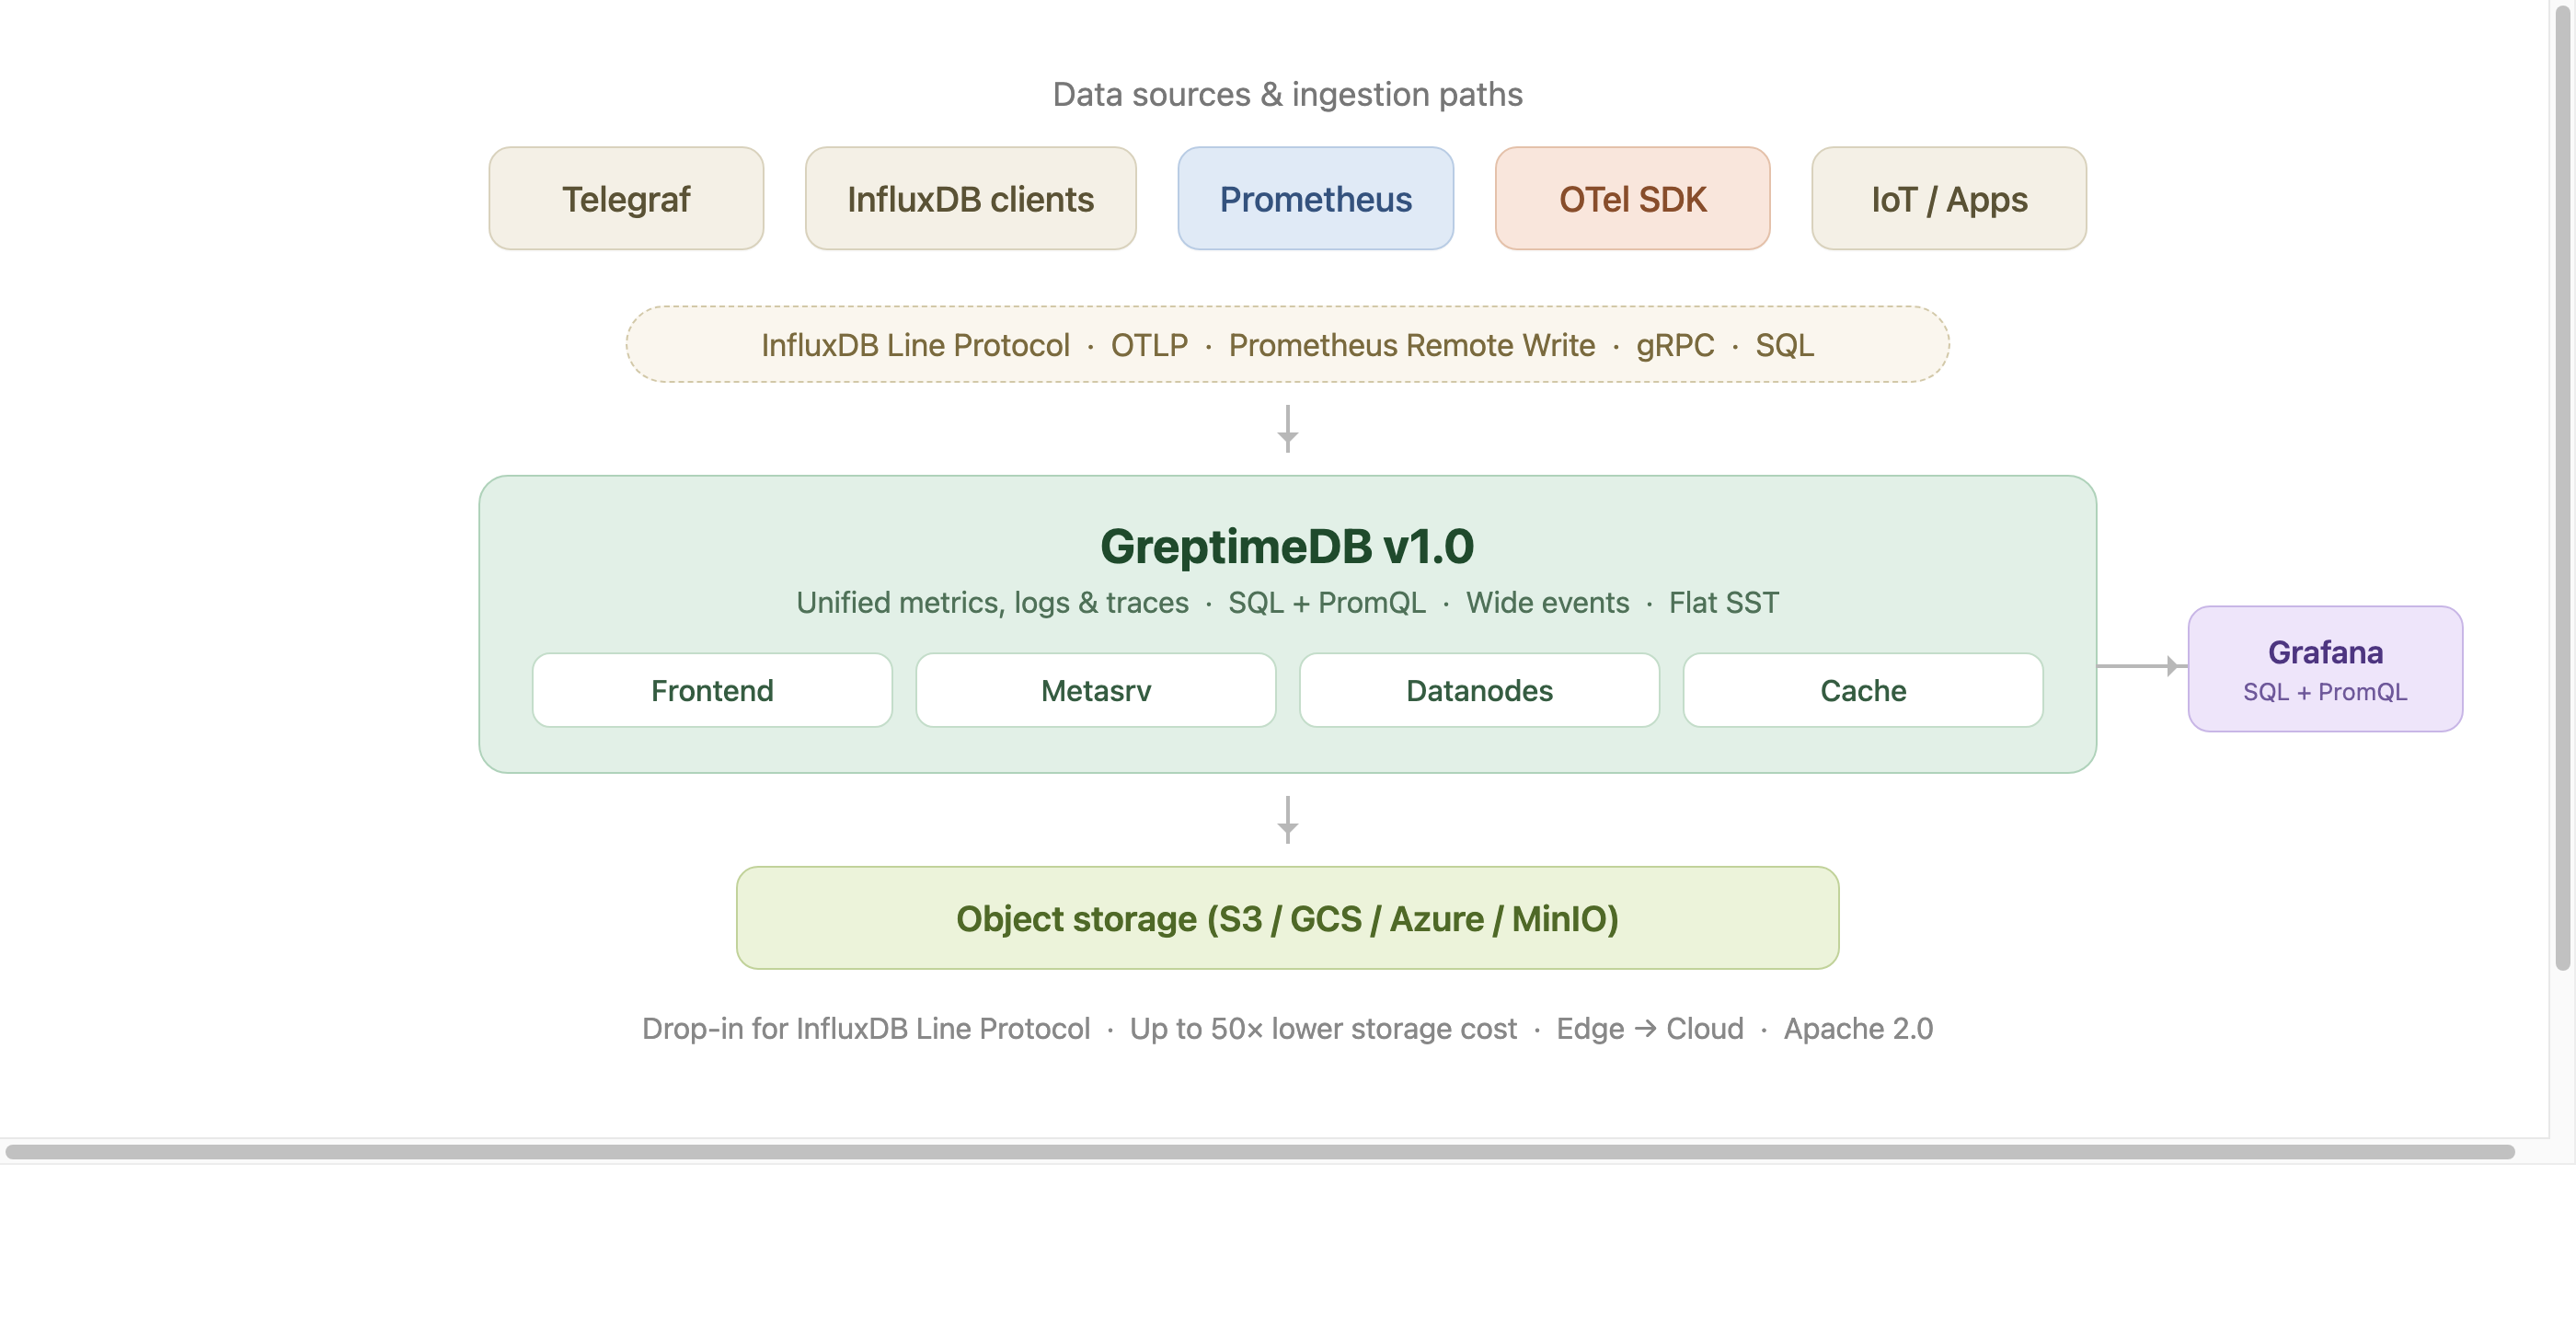
The picture below summarizes how GreptimeDB sits in an InfluxDB-style ingestion pipeline: existing clients (Telegraf, InfluxDB SDKs, Prometheus, OTel) write through the protocols you already use, GreptimeDB v1.0 unifies metrics, logs, and traces on Flat SST, and durable data lives in object storage. Grafana keeps querying through SQL and PromQL.
See also: for a side-by-side feature matrix (data model, ingestion protocols, query languages, storage format, licensing) see GreptimeDB vs. InfluxDB.
Unified Observability vs. Metrics-Only
InfluxDB primarily optimizes for metrics. GreptimeDB, by contrast, stores metrics, logs, and traces in the same engine, allowing a single SQL or PromQL query to correlate spikes in CPU with exception stacks or trace latency. This convergence eliminates the need to maintain separate Elastic/Loki or Jaeger clusters, lowering operational complexity and total cost of ownership (TCO).
A 2025 log benchmark makes the unified-engine claim concrete. Against Loki on the same etcd log dataset, GreptimeDB ingested 121K rows/sec (roughly 1.5× Loki's throughput), ran keyword searches 40–80× faster, and compressed the data to about 3% of the raw JSON versus Loki's 8%. For an InfluxDB user already running a separate log stack, this is the shape of the trade-off when you consolidate.
Rust-Based Core for High-Performance Ingestion
GreptimeDB is written in Rust, giving it the memory safety of modern languages without JVM garbage-collection pauses. On a Qualcomm Snapdragon 8295 automotive chipset, GreptimeDB Edge sustained 700K points/sec for 30 minutes at ~5.7% single-core CPU and 130–150 MB resident memory. That envelope makes it practical for real-time metrics, logs, and traces in IoT, automotive, or 5G scenarios where resource budgets are tight.
Familiar Query Interfaces—SQL and PromQL
Migrating from InfluxQL or Flux can be daunting. GreptimeDB lowers the barrier with ANSI-SQL plus PromQL coverage. Existing Grafana dashboards, Alertmanager rules, and Kubernetes ServiceMonitors continue to work — switch the remote-write endpoint and carry on. DeepXplore took this path when replacing Thanos: PromQL queries needed no adjustments, and the migration came down to changing the remote-write URL in Grafana Alloy.
High-Cardinality Time-Series Data Management
Traditional tag-based stores slow to a crawl when faced with millions of unique identifiers. GreptimeDB attacks this problem at the schema level:
- Keep ≤5 low-cardinality tags in the
PRIMARY KEY. - Add SKIPPING INDEX for equality filters on high-cardinality columns (e.g.,
device_id,user_id). - Use
INVERTED INDEXfor low-cardinality enums likehttp_status.
Following these rules delivers sub-second look-ups on billions of rows while capping index memory.
v1.0 ships a new storage format built for this problem. The Flat SST format, now the default, splits tag columns back into individual Parquet columns and drops the per-series memtable buffer design. On TSBS benchmarks with 2M series, write throughput improved roughly 4× and some query latencies dropped up to 10× versus the older primary_key format. If you are pushing InfluxDB into the millions-of-series range, Flat is the architectural change worth reading up on before you plan a migration.
Edge-to-Cloud Scalability & Kubernetes-Native Ops
GreptimeDB offers a lightweight Edge edition that syncs Parquet files to the cloud, then scales horizontally under the GreptimeDB Operator on Kubernetes. Enabling self-monitoring is a single YAML flag (spec.monitoring.enabled=true), after which a Vector sidecar ships GreptimeDB's own metrics and logs back into the cluster. This design supports hybrid deployment models without the operational gymnastics required by Kapacitor plus Chronograf.
Cost-Effective Object-Storage Architecture
Where InfluxDB Enterprise relies primarily on local SSDs, GreptimeDB stores immutable Parquet blocks directly in Amazon S3, Google Cloud Storage, Azure Blob, or MinIO. At current AWS list prices, S3 Standard (~$0.023/GB/mo) sits roughly 3–5× below provisioned SSD EBS (gp3 ~$0.08/GB/mo, io2 ~$0.125/GB/mo), and Glacier Deep Archive drops another order of magnitude for cold data. A multi-tier cache keeps recent data on NVMe for low-latency reads.
Combined with columnar compression and compute-storage disaggregation, the result can reach up to 50× total cost reduction for observability workloads versus vertically-integrated metrics databases. That is the number GreptimeDB's open-source product page leads with, and it is what an InfluxDB Enterprise deployment running on local SSDs will not match.
Wide Events: Beyond Metrics-Only Storage
InfluxDB's tag-and-field data model was built around pre-aggregated metrics. Modern observability practice, following the Observability 2.0 argument from Charity Majors, has shifted toward high-cardinality wide events: single rows that capture the full context of a request (method, path, latency, user ID, feature flags, trace ID, whatever else matters) instead of pre-binning that context into counters and gauges. Metrics, logs, and traces become views over the same event stream.
GreptimeDB was built as a database for wide events: columnar Parquet storage, flexible column types (including structured maps, JSON, and vectors), full-text and skipping indexes for cardinality control, and SQL as the primary query interface. A wide event is just a row with many columns, queried with the same SQL your BI tools already speak. InfluxDB's line-protocol tag/field split pushes you into a narrower data shape; GreptimeDB does not.
Enterprise Autopilot for Production Observability
Operating a metrics database at scale is where the gap between "works in dev" and "works at 3am" shows up. GreptimeDB Enterprise adds a set of autopilot features built for this stage:
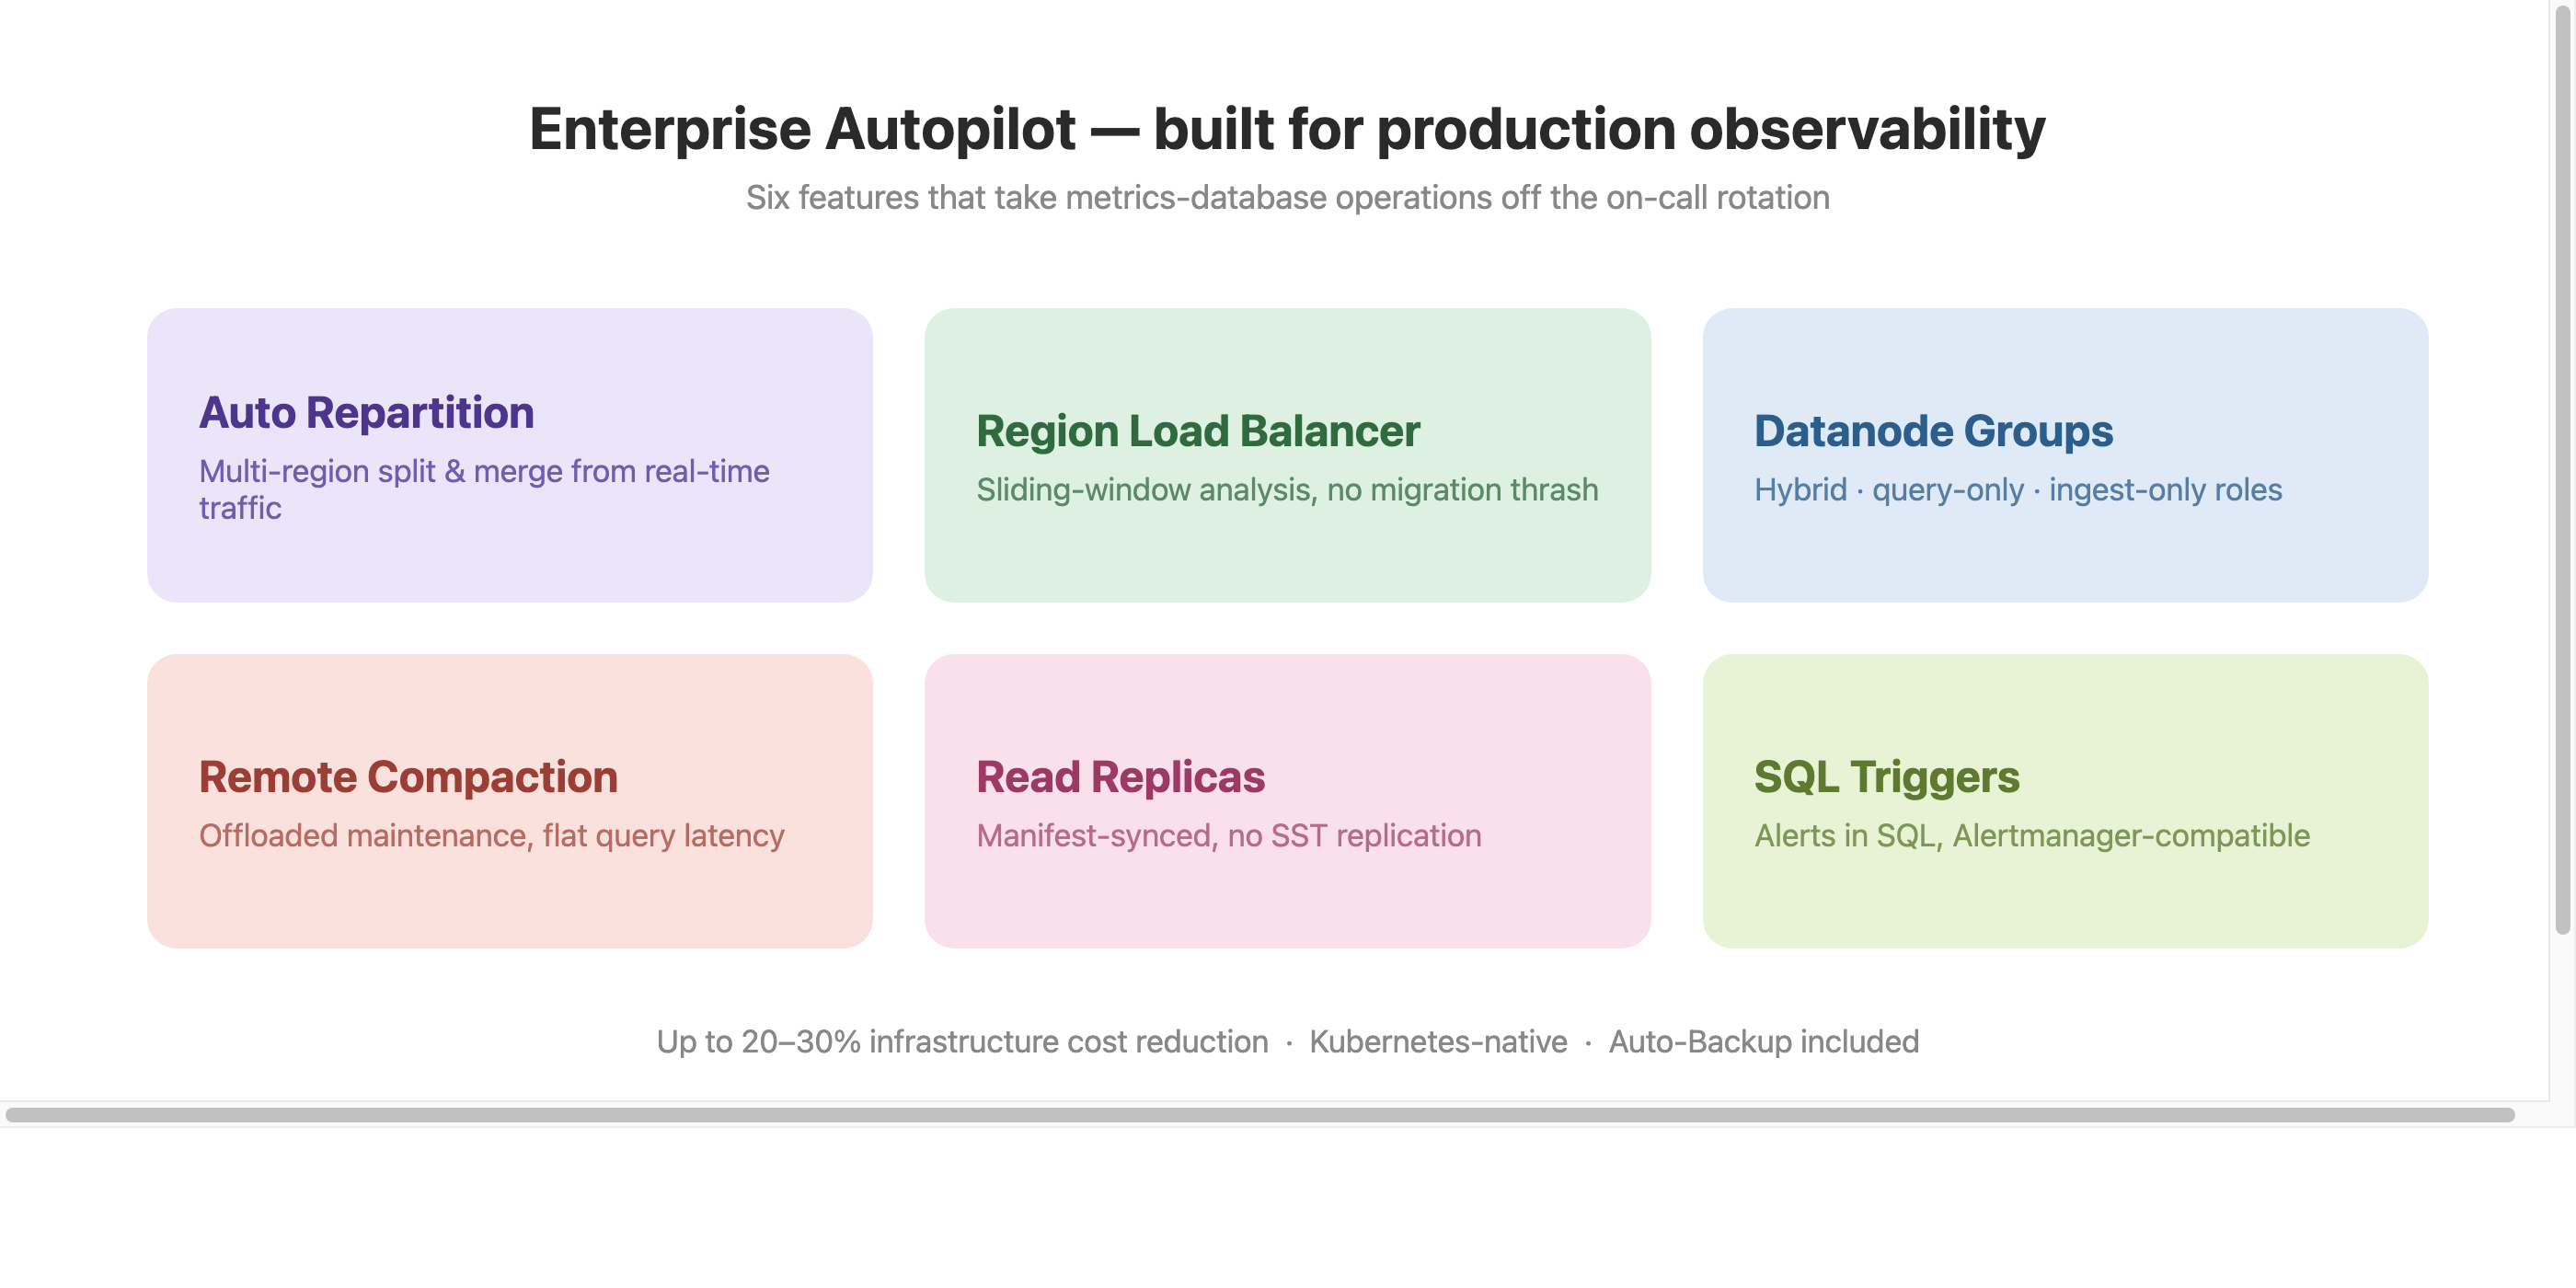
- Auto Repartition: multi-region split and merge triggered by real-time traffic, adjusting partition boundaries automatically rather than by manual reshaping.
- Automatic Region Load Balancer: sliding-window load analysis across datanodes, with configurable thresholds that avoid migration thrash while still resolving sustained imbalance.
- Datanode Groups: Kubernetes-native workload separation into hybrid, query-only, and ingest-only roles, removing contention between read and write paths.
- Remote Compaction & Auto-Backup: storage maintenance offloaded to dedicated compute, so query latency stays flat through compactions. Up to 20–30% infrastructure cost reduction from this alone.
- Read Replicas: dedicated read-only datanodes for analytical workloads, synced via manifest metadata without SST file replication.
- SQL-Native Triggers: alerting rules defined in SQL, evaluated periodically, compatible with Prometheus Alertmanager for grouping, inhibition, and routing.
InfluxDB Enterprise covers clustering and backups, but does not offer this class of load-driven, Kubernetes-native automation.
Bonus: Prometheus Long-Term Storage
GreptimeDB exposes a drop-in remote-write endpoint, making it a "Prometheus long-term storage solution." In DeepXplore's production environment, replacing Thanos with GreptimeDB reduced dependency count (etcd plus optional Kafka, versus Thanos's sidecar-query-store-compactor-ruler chain) and delivered queries "returning results much faster" than Thanos — in Stephan Stiefel's (DeepXplore CEO) own words from the migration writeup.
Conclusion
For teams evaluating an open-source, cloud-native observability database, GreptimeDB is a direct alternative to InfluxDB for metrics storage, high-cardinality series, unified logs and traces, Prometheus long-term storage, and Kubernetes-scale operations. v1.0 GA shipped in April 2026, Flat SST is the default storage format, and the API stays consistent from edge to cloud. Deploy with the GreptimeDB Operator on Kubernetes to test it against your current InfluxDB workload.
About Greptime
GreptimeDB is an open-source, cloud-native database purpose-built for real-time observability. Built in Rust and optimized for cloud-native environments, it provides unified storage and processing for metrics, logs, and traces—delivering sub-second insights from edge to cloud —at any scale.
GreptimeDB OSS – The open-sourced database for small to medium-scale observability and IoT use cases, ideal for personal projects or dev/test environments.
GreptimeDB Enterprise – A robust observability database with enhanced security, high availability, and enterprise-grade support.
🚀 We’re open to contributors—get started with issues labeled good first issue and connect with our community.
Stay in the loop
Join our community
Get the latest updates and discuss with other users.


