InfluxDB for Observability: Why Metrics-Only Falls Short on Logs and Traces
Introduction
InfluxDB is a strong metrics database. Line protocol is simple, IoT ingestion is fast, and the v1 storage engine is one of the most deployed time-series engines in production. None of that solves the rest of the observability problem.
Teams that adopt InfluxDB rarely stop there. Metrics go into InfluxDB, logs end up in Elasticsearch or Loki, traces land in Jaeger or Tempo, and a service mesh of dashboards tries to stitch the three together. The result is the kind of stack the observability "three pillars" framing predicts: three storage engines, three query languages, three operational runbooks, three retention policies.
This article looks at what that costs in practice and where GreptimeDB lands when one engine has to cover all three signals. It is not about replacing InfluxDB for pure metrics workloads; for IoT and line-protocol ingestion, InfluxDB still works fine. It is about whether the second and third stack are still load-bearing once the database underneath the metrics is built for wide events from day one. The general InfluxDB-vs-GreptimeDB story for time-series workloads is covered separately; this piece focuses on the logs-and-traces gap.
Where InfluxDB Excels and Where It Stops
InfluxDB's strengths are real. Line protocol is one of the simplest write paths in the industry and supported by virtually every metrics agent. Pure-metrics IoT workloads at single-node scale are well-served by the v1/v2 storage engine. Retention policies and continuous queries cover a wide range of operational monitoring needs.
The friction shows up when the workload widens beyond metrics. InfluxDB does not ship a full-text index, a trace data model, or a high-cardinality storage layout built for log bodies and span attributes. The trajectory across v1, v2, and v3 (Go to Rust, TSM to FDB and then to a Parquet/DataFusion stack) shows the engine adapting to broader workloads, but the licensing and version question itself becomes a planning cost: pick the wrong major version and the migration story changes underneath the deployment.
Most observability teams react by adding parallel stacks for logs and traces. That is the cost this article is about.
The Hidden Cost of Three Separate Stacks
Running InfluxDB plus Elasticsearch (or Loki) plus Jaeger (or Tempo) is normal. It is also expensive, in four dimensions that often go unmeasured.
The operational tax is the most visible. Each system has its own deployment model, scaling story, upgrade cadence, and failure mode. The team has to know all three. Schema and capacity planning happen three times.
The storage tax is less visible but bigger. The same request can show up as a request-rate metric, a structured access log, and a span in a trace. Three systems each store their own slice, often replicated, often retained on different timelines.
The query tax shows up at incident time. A latency spike in InfluxDB, an error log in Elasticsearch, and a slow span in Jaeger almost certainly describe the same incident. Correlating them means cross-system queries (usually with a third tool stitching the results) instead of a single SQL join.
The schema tax is the slow one. A field added in the trace exporter does not automatically show up in the logs pipeline or the metrics labels. Over time the three stores drift on what they call the same thing.
The 2024 GreptimeDB TCO analysis frames the same problem at a higher level: capex from over-provisioning each stack to peak load, opex from running three teams' worth of operational knowledge, and opportunity cost from the senior engineers it pulls away from product work.
Logs and Traces as Wide Events in One Engine
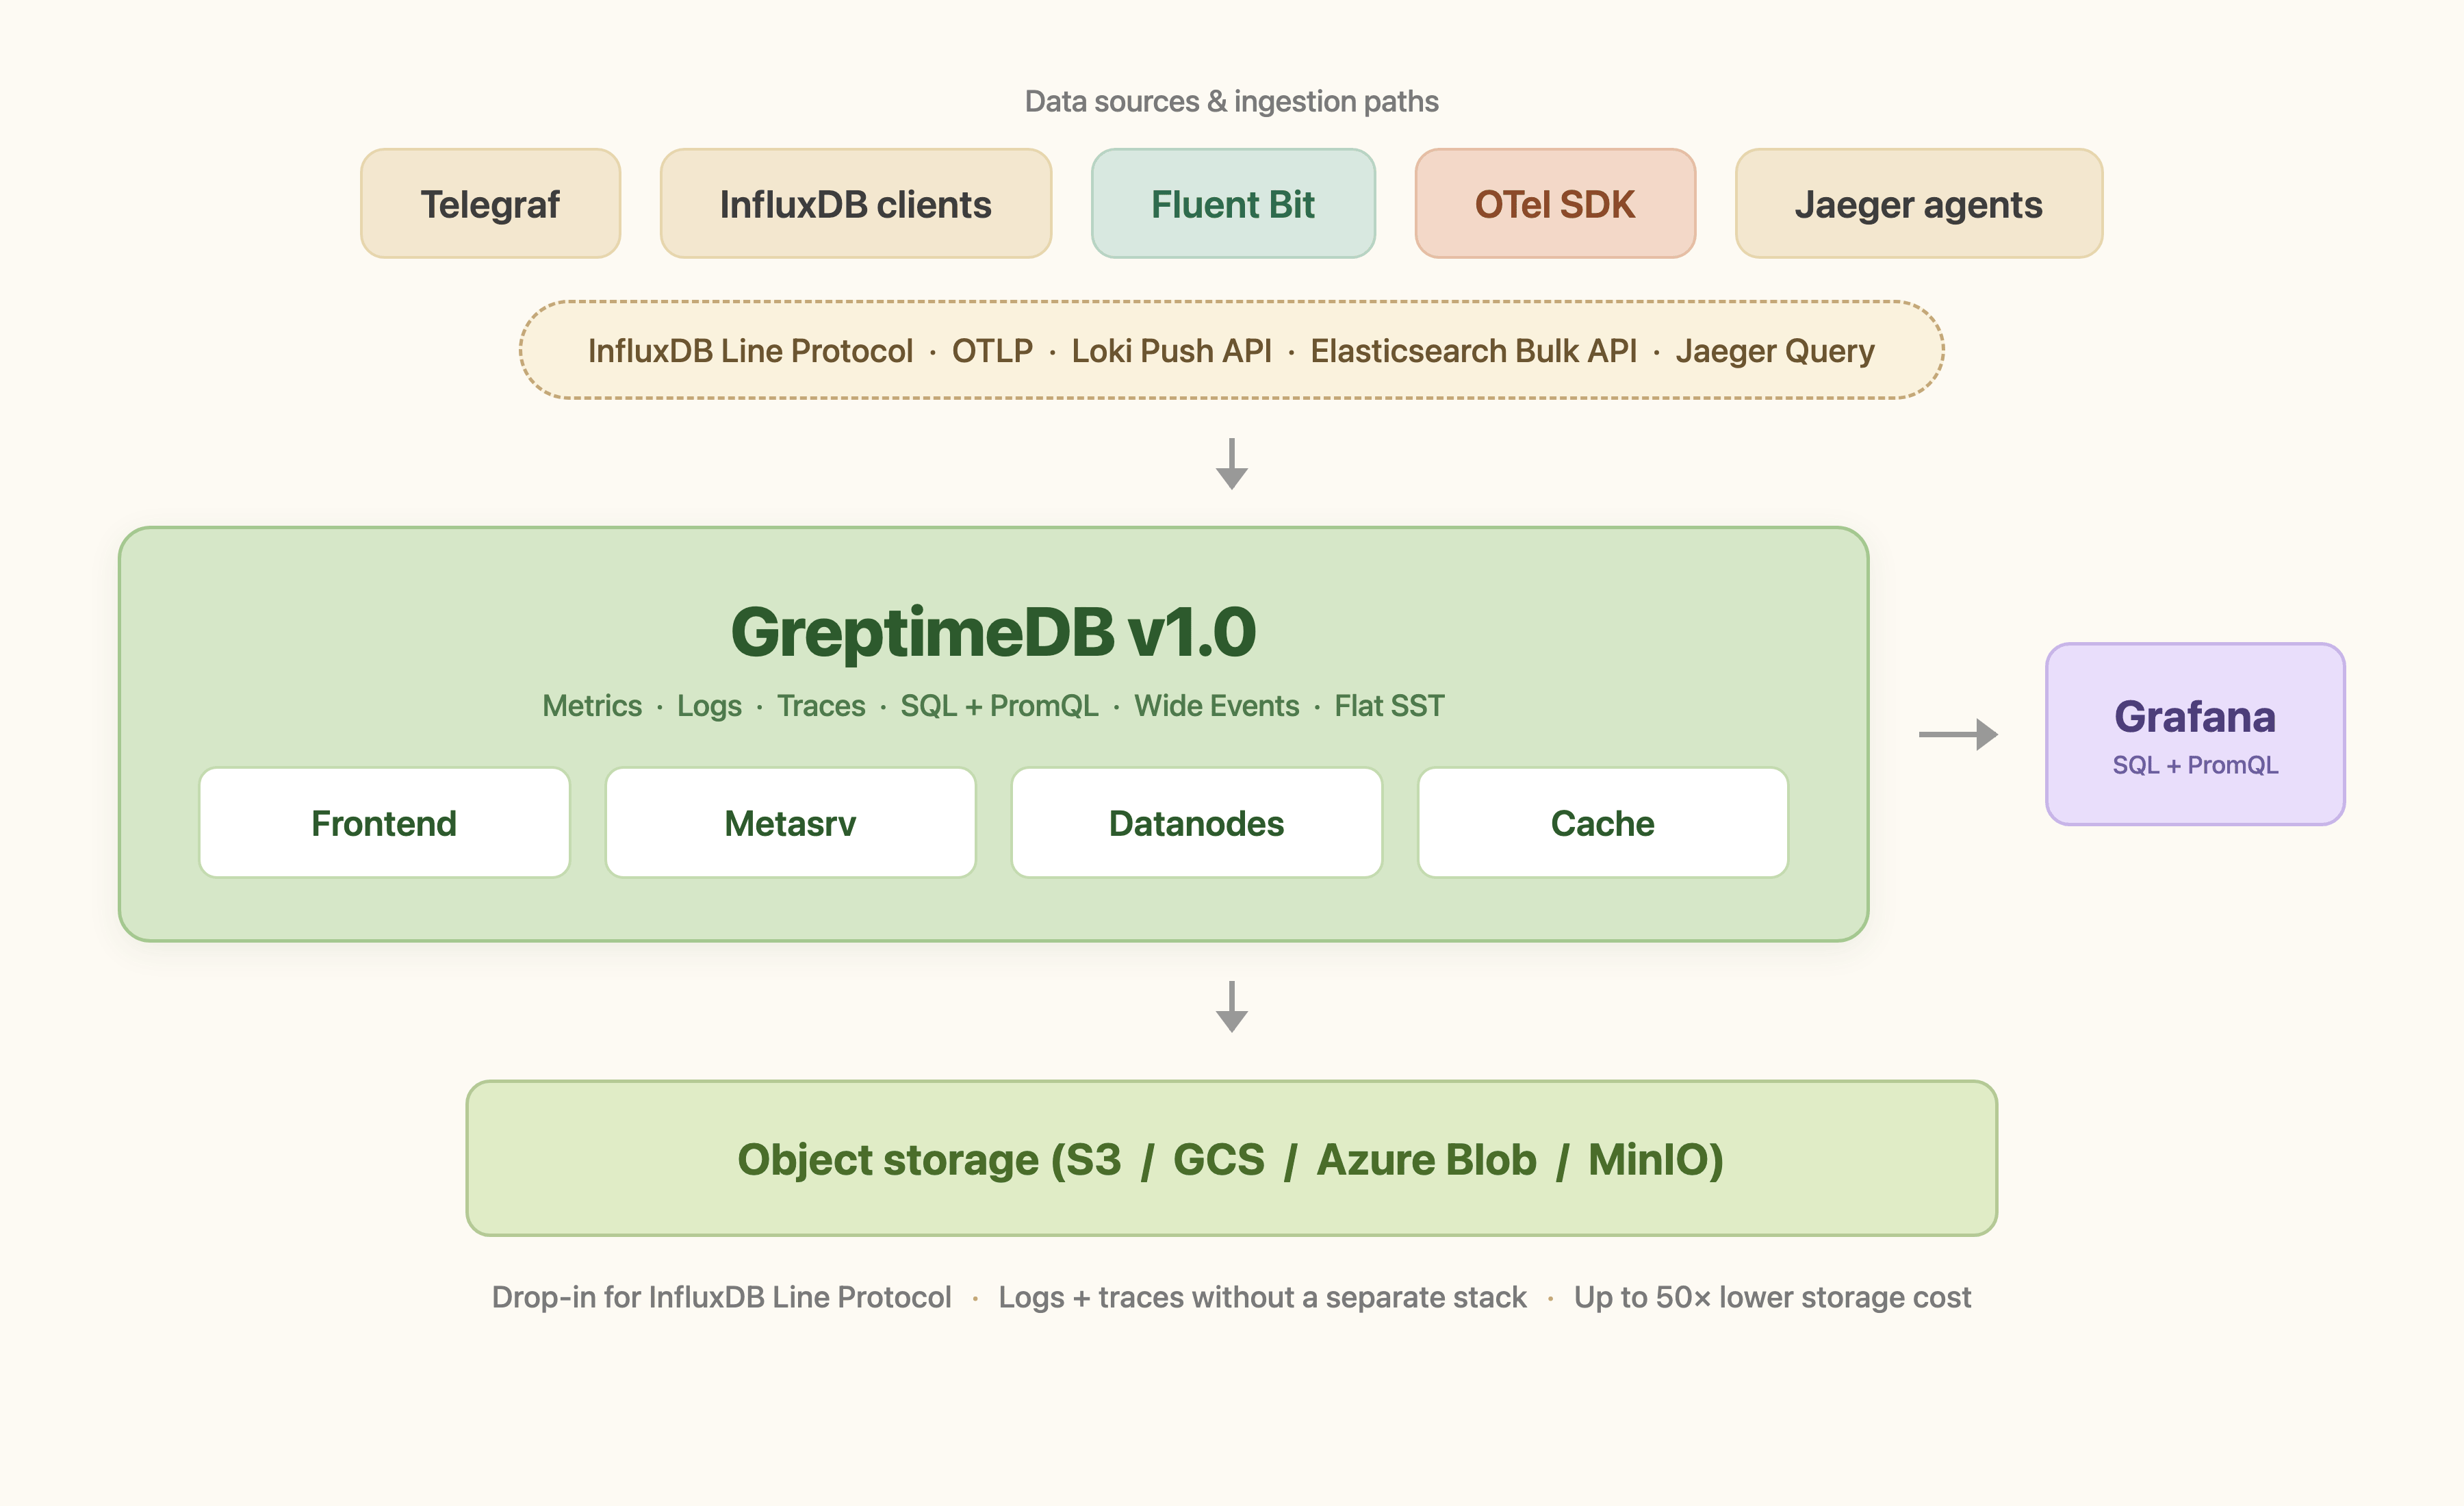
GreptimeDB treats metrics, logs, and traces as variants of the same primitive: a wide, columnar event with a timestamp, a set of tag columns, and any number of typed field columns. The same engine that holds metrics holds logs and traces, with different index choices per workload.
A representative log table from a production deployment looks like this:
CREATE TABLE app_log (
  "timestamp" TIMESTAMP(9) NOT NULL,
  "host" STRING,
  "service" STRING,
  "request_id" STRING SKIPPING INDEX,
  "message" STRING FULLTEXT,
  TIME INDEX ("timestamp"),
  PRIMARY KEY ("host", "service")
) WITH (append_mode = 'true', ttl = '15days');
Three index types are picked per column intent: FULLTEXT on the log body for keyword search, SKIPPING INDEX on high-cardinality lookups like request_id, and time-window partitioning aligned with retention. Traces use the same shape with span-id and parent-span-id columns. Metrics use the same shape with a numeric value column and no full-text index.
Ingestion happens through whichever protocol the workload already speaks. The same instance accepts OpenTelemetry OTLP for metrics, logs, and traces; the Loki Push API for log pipelines built around Promtail or Fluent Bit; the Elasticsearch Bulk API; the Jaeger Query API for trace visualization; and InfluxDB line protocol for the existing metrics path. There is no separate ingestion layer per signal.
GreptimeDB v1.0 GA, released in April 2026, marked the point where this design moved from a fast-moving project to a stable platform with a committed compatibility contract. The new Flat SST storage format shipped as the default in the same release. It splits tag columns back into individual Parquet columns and improves write throughput roughly 4× and some query latencies up to 10× on TSBS-style workloads with 2M series, which is the kind of cardinality logs and traces routinely produce.
Benchmark Reality Check: Logs at Production Scale
InfluxDB does not publish first-party log benchmarks against full-text engines, because logs are not its target workload. The relevant comparison is therefore against the systems that would otherwise sit alongside InfluxDB in a three-stack deployment.
Against Loki, a 2025 log benchmark ran the same etcd log dataset (~83 GB raw NDJSON) through both engines. GreptimeDB sustained 121K rows/sec, about 1.5× Loki's throughput, and 102K rows/sec when writing directly to object storage. Keyword searches ran 40–80× faster than Loki, and cached repeated queries exceeded 500×. Persisted storage was 3.03 GB for GreptimeDB versus 6.59 GB for Loki, roughly 50% lower at the same ingestion parity.
Against Elasticsearch, a separate Nginx log benchmark at 20K rows/sec measured GreptimeDB at 408 MB of memory and 13.2% CPU versus Elasticsearch at 9.9 GB and 40.2% CPU on the same workload. Persistent storage came out at 12.7% of Elasticsearch's footprint.
In production at scale, the clearest single data point is OceanBase Cloud, which migrated its multi-cloud log platform off Grafana Loki onto GreptimeDB. A year in: 80+ clusters across seven public clouds, 300 TB of logs and SQL audit data under a 7-day retention, around 1 GB/s of sustained writes, and overall log storage cost down by more than 60%. Queries that timed out on Loki now return in sub-second to single-second latency, and the default query time range went from minutes to days.
The numbers from these workloads are not what an InfluxDB-only logging setup can deliver, because InfluxDB does not target this workload. The choice is not "InfluxDB vs GreptimeDB for logs." It is "GreptimeDB vs the Elasticsearch-or-Loki stack you currently run next to InfluxDB."
Migration Path: Coexistence Before Replacement
Replacing a metrics database is risky; replacing the logs or traces stack alongside it is usually easier and lower-blast-radius. A pragmatic migration order:
- Keep InfluxDB line protocol working against GreptimeDB. GreptimeDB accepts line protocol natively, so existing metrics agents do not change.
- Route logs into GreptimeDB through the Loki Push API, Elasticsearch Bulk API, or OTLP. Existing Fluent Bit, Vector, or OpenTelemetry Collector configurations require only an endpoint swap.
- Route traces into GreptimeDB through OTLP and visualize through the Jaeger Query API. Existing Grafana trace dashboards continue to work.
- Cut over metrics last, once the unified query path through SQL and PromQL has been validated on logs and traces.
This sequence lets the team capture the wide-events benefit (one query joining metrics, logs, and traces) without a high-risk metrics migration on day one.
When InfluxDB Still Wins
For neutrality:
- Pure-metrics IoT with line-protocol-native agents, modest scale, and no logs/traces requirement: InfluxDB remains a clean choice.
- Deep Flux pipelines: teams with significant investment in Flux ETL or InfluxDB-native tasks pay a real porting cost to move.
- InfluxDB 3 (Core/Enterprise) with the Parquet/DataFusion stack: where the workload aligns with the new engine's strengths, the cross-version migration cost is similar to switching engines.
The point of this article is not that InfluxDB is the wrong call for metrics. It is that the second and third stacks running alongside it usually are.
Conclusion
A modern observability workload is metrics, logs, and traces, not just metrics. Stacks built around InfluxDB end up adding Elasticsearch or Loki for logs and Jaeger or Tempo for traces, then running three sets of operational knowledge to keep them stitched together. The economics shifts when one engine handles all three signals with full-text indexes for logs, span data models for traces, and PromQL plus SQL for queries. Whether that engine replaces InfluxDB on day one matters less than whether it can absorb the next stack (logs, then traces) without adding a fourth one.
About Greptime
GreptimeDB is an open-source, cloud-native database purpose-built for real-time observability. Built in Rust and optimized for cloud-native environments, it provides unified storage and processing for metrics, logs, and traces, delivering sub-second insights from edge to cloud at any scale.
- GreptimeDB OSS: the open-source database for observability and IoT workloads, with compute-storage disaggregation and object storage as the primary tier.
- GreptimeDB Enterprise: adds operational features for production scale, including 5× bulk ingestion, auto-repartition, read replicas, LDAP/RBAC, management console, and 24/7 expert support.
Stay in the loop
Join our community
Get the latest updates and discuss with other users.


