Wide Events, Explained: The Data Model Behind Observability 2.0
Introduction
Most monitoring setups make you guess. When you instrument a service, you decide up front which metrics to emit, which labels they carry, and which fields your log lines include. That decision happens at write time. But the questions you actually need to answer show up at read time, usually at 2 a.m., and they are almost never the ones you planned for. "Why are checkout requests slow, but only for users on the new mobile build, in one region, paying with one specific provider?" If build_id, region, and payment_provider were not part of your metric labels, that question is unanswerable. The data to answer it was thrown away before it was ever stored.
This gap between write-time decisions and read-time questions is the problem "Observability 2.0" tries to close, and wide events are the data model that makes it work.
What a Wide Event Actually Is
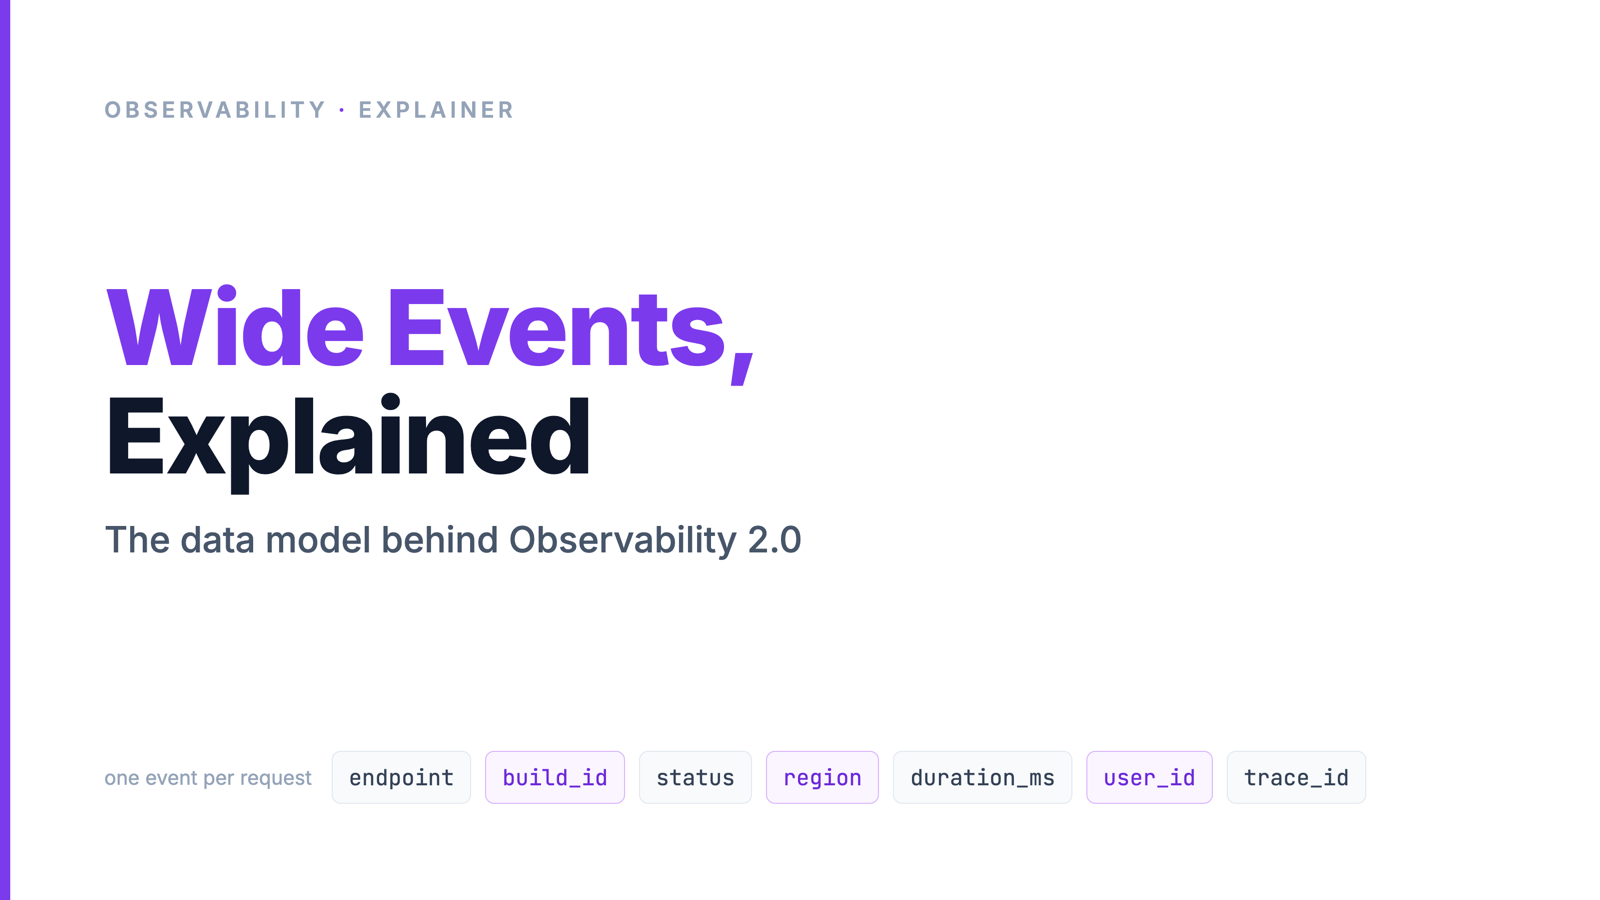
A wide event is one structured record per unit of work, carrying as much context as you can attach to it. For a web service, the unit of work is usually a single request. Instead of incrementing a few counters and writing a couple of log lines, the service emits one event when the request finishes, with every field that might matter:
{
  "timestamp": "2026-06-10T14:22:03.221Z",
  "service": "checkout",
  "endpoint": "POST /api/checkout",
  "status_code": 500,
  "duration_ms": 1840,
  "user_id": "u_8821",
  "region": "ap-southeast-1",
  "build_id": "2026.6.2-rc1",
  "payment_provider": "stripe",
  "db_query_ms": 1620,
  "cache_hit": false,
  "feature_flags": ["new_checkout_ui", "async_receipts"],
  "trace_id": "a1b2c3...",
  "error": "payment gateway timeout"
}
That is one row. A busy endpoint produces millions of them. Each one is a fact about something that really happened, with the dimensions kept intact rather than averaged away.
Compare that to the three pillars. A metric like http_requests_total{status="500"} tells you 500s went up, but it cannot tell you they were concentrated on one build, because adding build_id and user_id as labels would blow up cardinality and cost. A plain log line has the context but no structure, so you grep it and hope. A trace has the structure but is usually sampled, so the one request you care about is often the one that got dropped. The wide event keeps the structure and the context in a form you can query.
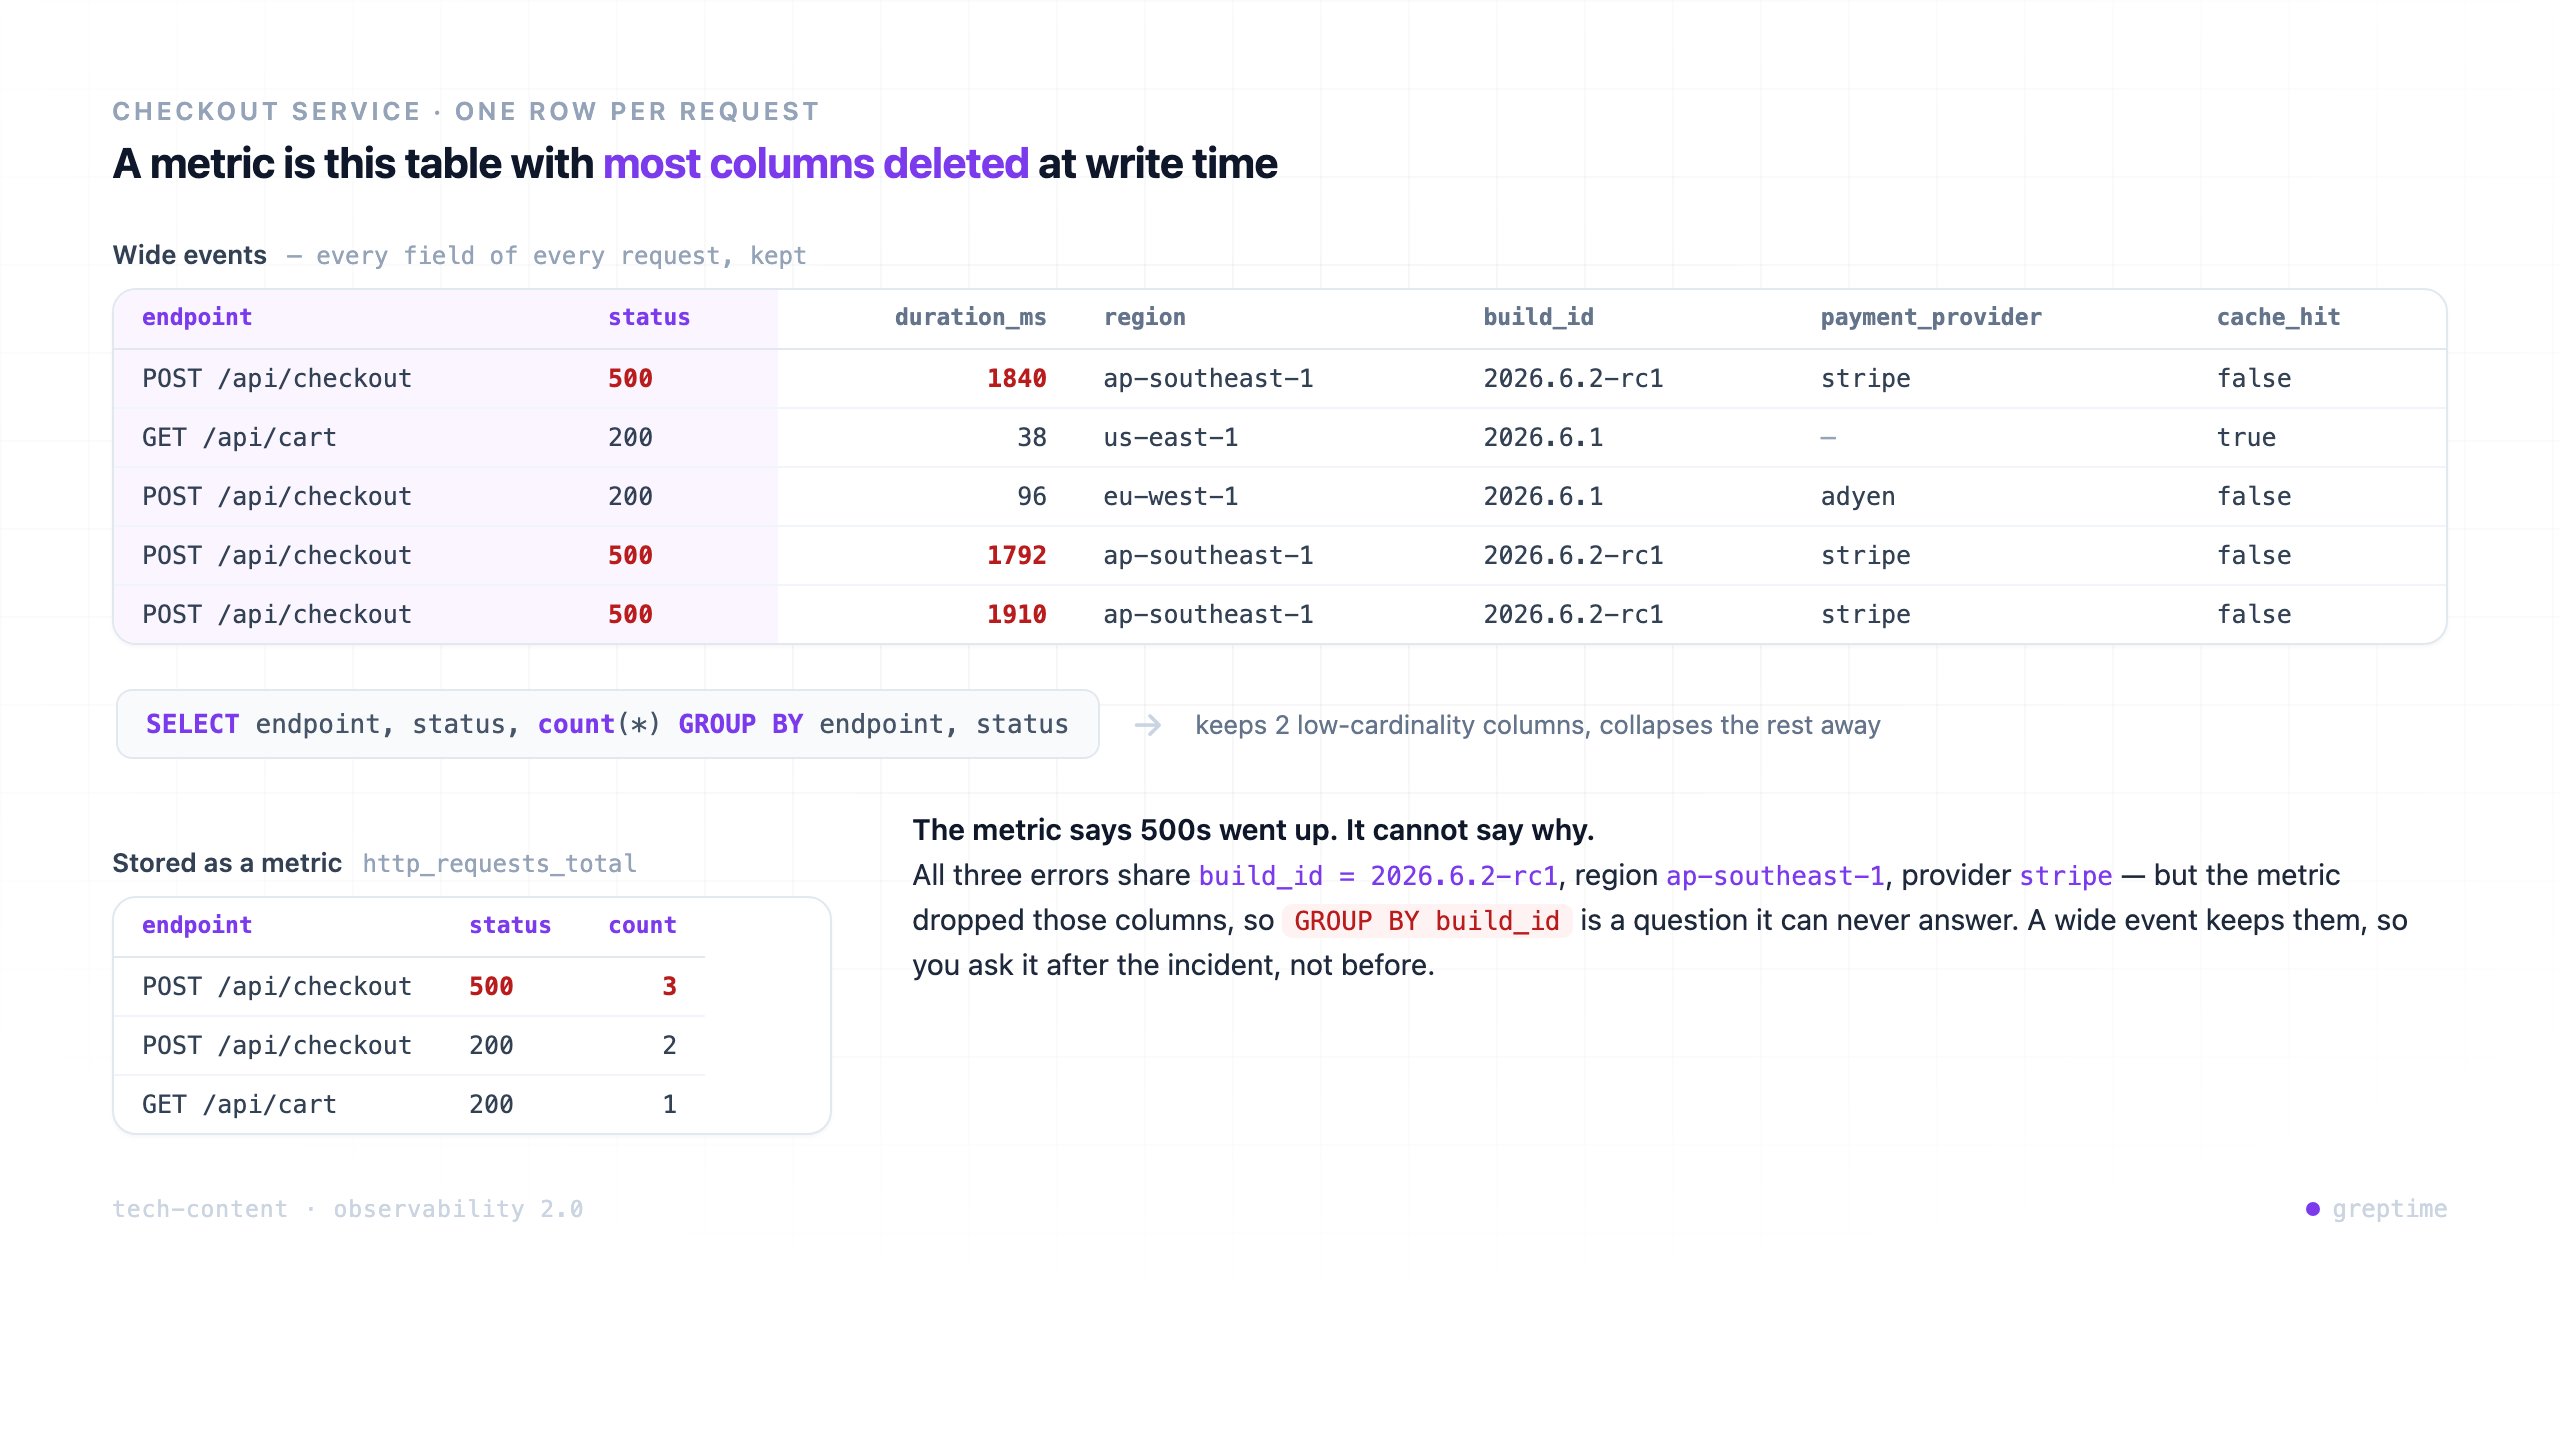
GROUP BY build_id needs a column the metric never kept.Where the Idea Came From
This is not new. Meta built an internal system called Scuba around 2013 for exactly this: ingest raw, wide events and slice them along any dimension at query time, fast enough to explore interactively. The Scuba paper describes a database that took in millions of events per second specifically so engineers could ask unplanned questions during an incident. Stripe later wrote about "canonical log lines," the practice of emitting one rich, structured summary line per request instead of scattering context across many lines. Honeycomb productized the approach for the wider industry and has spent years arguing that this is what real debugging needs.
The pattern keeps getting reinvented because it solves a problem aggregation cannot: you can only group by a dimension you still have.
What Observability 2.0 Means
The core claim is about sources of truth. Charity Majors, Honeycomb's co-founder, is the one who put the "1.0 versus 2.0" label on it in a post titled It's Time to Version Observability, and the distinction is sharper than the usual "collect more telemetry" pitch.
In the 1.0 model you maintain three separate stores: a metrics system, a log system, and a tracing system. Each has its own storage, its own query language, and its own copy of overlapping information. To investigate an incident you jump between them and reconstruct the story by hand. Worse, each store has already discarded something at write time: metrics pre-aggregated away the high-cardinality dimensions, traces sampled away most of the requests, logs kept the text but dropped the schema.
In the 2.0 model there is one source of truth: the wide events. Metrics, traces, and log-style views are derived from those events at query time rather than stored as separate primitives. A request rate is a COUNT over events grouped by time. A latency heatmap is a distribution over the duration_ms field. A trace is the set of events sharing a trace_id. Because the raw dimensions are still there, you can group by build_id after the incident, not just before it. You can ask questions you did not anticipate, which is the entire point of observability as opposed to monitoring.
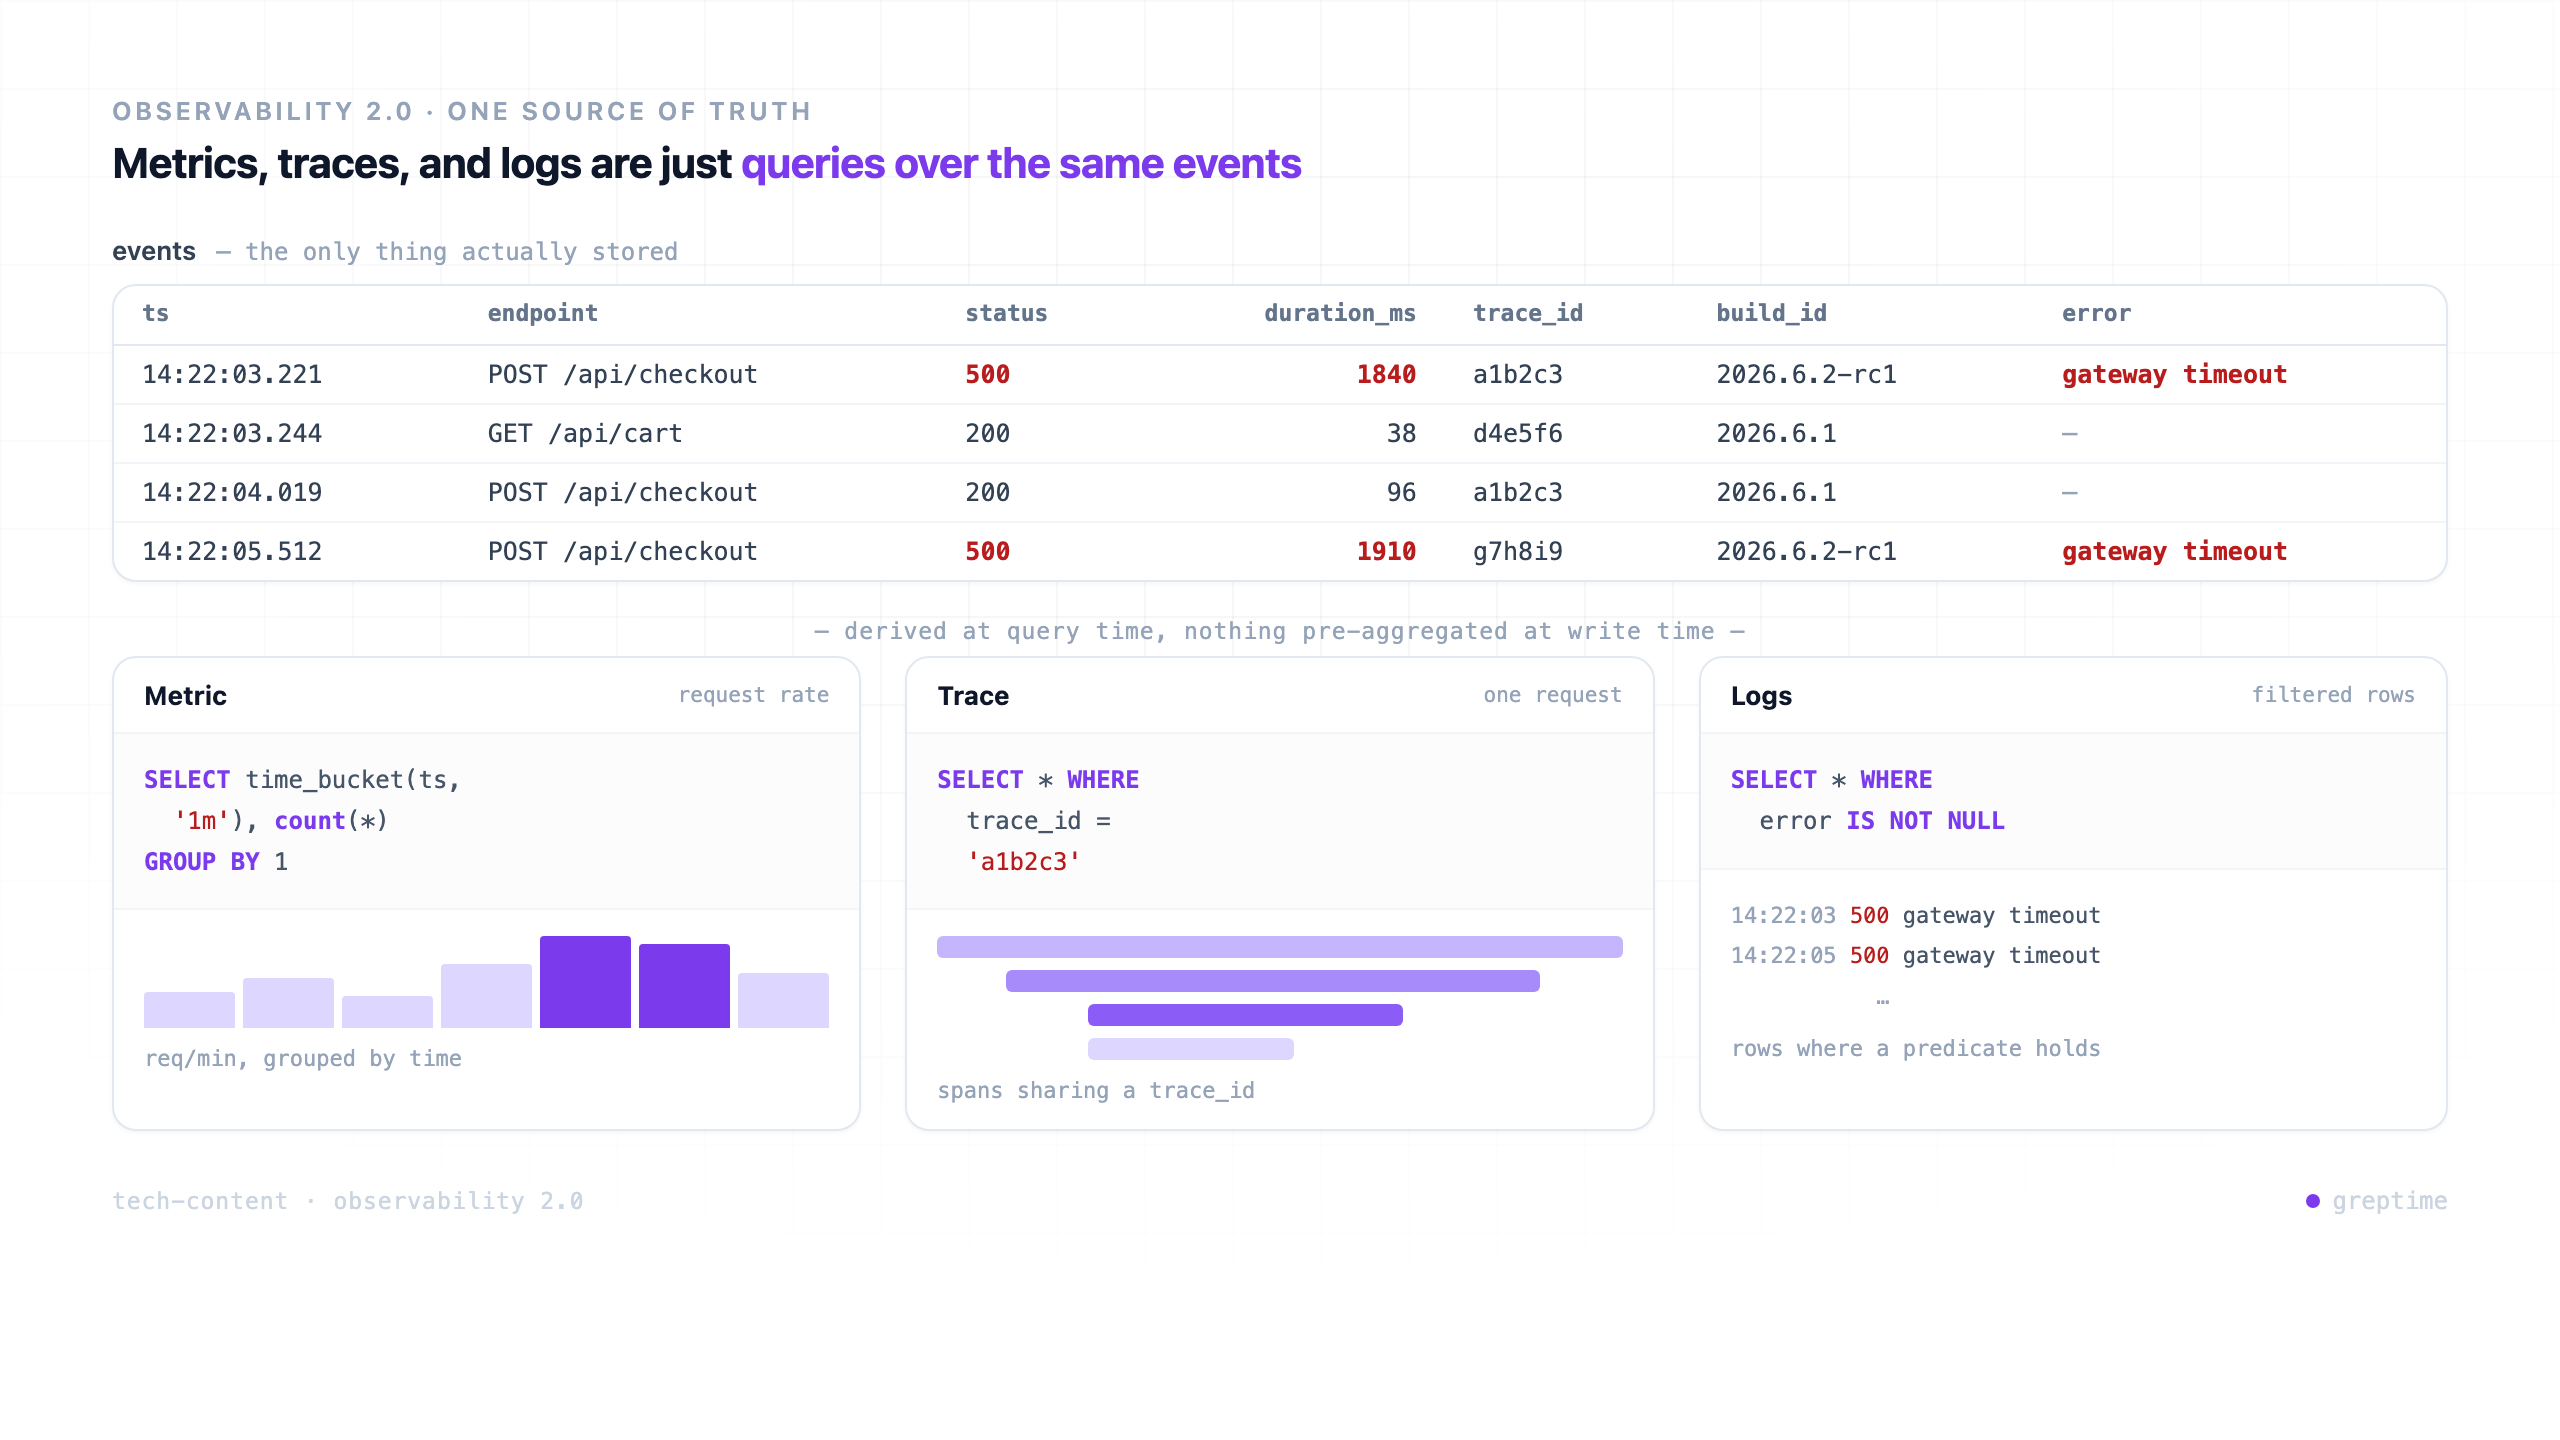
SELECTs over it, derived at query time instead of written to three separate stores.Why This Is Happening Now
If wide events are obviously better for debugging, why did the industry pre-aggregate everything into metrics in the first place? Cost.
High-cardinality data is expensive to store and query. A metrics database keyed on user_id falls over because every unique value creates a new time series. So the standard advice for a decade was to keep labels low-cardinality and throw away the interesting dimensions. The three-pillar split was, in part, a workaround for storage that could not handle wide, high-cardinality data economically.
Two things changed that. Columnar storage handles wide rows with many sparse fields far better than the row-oriented or series-oriented engines that metrics systems were built on, because a query only reads the columns it touches and columnar compression on repetitive fields is very good. And object storage made the bytes themselves cheap, so keeping months of raw events stopped being a budget conversation. Our own log benchmark against Loki and Elasticsearch shows what a columnar engine on object storage does to observability-scale data at rest. Observability 2.0 is less a new idea than an old idea that finally became affordable.
That reframes the whole thing as a database problem. "Store wide events and derive metrics, traces, and logs from them" is a statement about a query engine, not a dashboard. You need a store that ingests high-cardinality structured data, compresses it on object storage, and answers both analytical questions ("group all checkout errors by build and region over the last week") and time-series questions ("p99 latency per minute") without forcing you into two systems again.
Why AI Agents Make This Urgent
The clearest case for wide events right now is AI agents. An agent application emits exactly this shape of data: one execution step carries the model name, token counts, latency, the full prompt and response, a list of tool calls with dynamic parameters, the reasoning behind a decision, and the memory state it read. That is dozens to hundreds of fields per event, much of it semi-structured, with high-cardinality keys like session_id and trace_id on every row.
The three pillars handle this badly. Stuff the prompt and tool output into logs and you lose the structure you need to query them. Force the dynamic tool-call schema into traces and it is too rigid to fit. Pre-aggregate token usage into a metric and you can no longer trace a latency spike back to the specific prompt that caused it. And the questions teams ask about agents are not "is it up" or "how fast," but "was the answer right, was the tool choice sensible, did it hallucinate." Those are semantic-quality questions you can only answer by keeping the raw event and deriving new dimensions from it after the fact. Honeycomb has pointed out that mature observability datasets routinely carry hundreds of dimensions, which is exactly what metric pre-aggregation cannot cover.
That takes wide events from "better" to close to mandatory, and the database vendors have noticed: ClickHouse built its ClickStack around the wide-event model, and unified observability databases are moving the same way. We walk through the agent case in detail in Agent Observability: Can the Old Playbook Handle the New Game?.
Where Wide Events Get Stored
Teams do this a few different ways today.
Honeycomb remains the clearest expression of the model as a hosted product, with a query interface built around exploring events by dimension. A lot of teams build their own version on a columnar analytics database, most commonly ClickHouse, wiring up ingestion and a query layer themselves. And there are databases aimed directly at this unified shape.
GreptimeDB is one example: an open-source database that stores metrics, logs, and traces in a single engine on object storage, and lets you query the same data with SQL for analytical slicing and PromQL for the time-series views people already have dashboards for. It is built in Rust with compute and storage separated, which is the shape this model needs, and it frames its own design around Observability 2.0 and wide events directly. CrateDB reaches for the same unified target from a search-and-analytics starting point, and InfluxDB's columnar 3.0 direction is a move toward it as well.
The takeaway is not which product. It is that the storage layer is the part of "Observability 2.0" that was actually missing, and it is the part that is now solved well enough to build on.
When Wide Events Are Not the Answer
Worth being honest about the limits, because the model has real costs.
Wide events do not replace high-volume infrastructure metrics. If you are scraping CPU and memory off ten thousand containers, a counter is the right tool and emitting a wide event per sample would be wasteful. Metrics are a fine, cheap aggregate when you already know the question and the cardinality is low.
Wide events also move work onto your instrumentation. The model is only as good as the fields you attach, and getting build_id, feature_flags, and the right business dimensions onto every event takes deliberate effort across a codebase. OpenTelemetry span attributes help, since a span is already a structured event with a place to hang context, but the team still has to decide what context matters.
And storage is cheaper, not free. Keeping every raw event at full fidelity for a year is affordable on object storage in a way it was not before, but it is not zero, and very high-throughput systems still need sampling strategies. The advantage is that you can now make that trade-off deliberately, rather than having it forced on you by a metrics backend that simply cannot hold the data.
The Short Version
Observability 1.0 asks you to decide what you will want to know before anything goes wrong, and quietly discards the rest. Wide events keep the full context of each unit of work in a structured, queryable form, and Observability 2.0 derives metrics, traces, and logs from that single source of truth at read time. The idea is a decade old; what changed is that columnar engines on object storage made it cheap enough to be the default rather than a luxury. If you have ever been blocked at 2 a.m. by a dimension you did not think to add as a label, you already understand why teams are making the switch.
About Greptime
GreptimeDB is an open-source, cloud-native database purpose-built for real-time observability. Built in Rust and optimized for cloud-native environments, it provides unified storage and processing for metrics, logs, and traces, delivering sub-second insights from edge to cloud at any scale.
- GreptimeDB OSS: the open-source database for observability and IoT workloads, with compute-storage disaggregation and object storage as the primary tier.
- GreptimeDB Enterprise: adds operational features for production scale, including 5× bulk ingestion, auto-repartition, read replicas, LDAP/RBAC, management console, and 24/7 expert support.
Stay in the loop
Join our community
Get the latest updates and discuss with other users.


